
The Anatomy of an LLM Benchmark
Common patterns used to create the most effective LLM evaluation datasets...

Throughout the history of AI research, progress has been measured—and accelerated—by high-quality benchmarks. AI is an empirical field that is driven by discovering interventions that improve performance on key benchmarks. For large language models (LLMs) in particular, creating useful benchmarks is hard due to rapidly advancing model capabilities. Tough evaluations are regularly saturated as new models are released, creating the need for continual evolution toward harder problems and new dimensions of performance. Despite the pivotal role of benchmarking in driving progress, evaluation has traditionally received less attention compared to core modeling research. Additionally, creating high-quality benchmarks requires unique skills that are emphasized less heavily in the literature. This overview aims to solve these problems by providing an extensive survey of useful LLM benchmarks and the techniques—including both practical tricks and more recent directions of research—used to create them.
Disclaimer. Agent and coding benchmarks are notably absent from this overview. These domains are rapidly advancing and require unique evaluation techniques that have led to the creation of completely new areas of research in LLM evaluation. Due to their depth, these topics will require an overview of their own, and several useful resources on these topics are already available.
Dissecting Popular LLM Benchmarks
The best way to understand how LLM benchmarks are created—and how we can create a useful benchmark for our own task of interest—is to simply study details of the most popular and effective LLM benchmarks. In this section, we will select a wide variety of LLM benchmarks, including both recent benchmarks and those that have been around for a while, and outline the following characteristics:
How the data is sourced
How data quality is ensured
How model performance is measured
How each benchmark has evolved as models have improved
Admittedly, this section is far from comprehensive—a vast number of LLM benchmarks exist, and surveying them all would be impossible. Instead, this section optimizes for diversity and aims to provide a wide view of the different kinds of benchmarks that exist and the various strategies that are commonly used to create useful evaluation datasets across these many different domains.
Massive Multitask Language Understanding (MMLU) [1]
“To succeed at our test, future models should be well-rounded, possess extensive world knowledge, and develop expert-level problem solving ability. These properties make the test likely to be an enduring and informative goalpost.” - from [1]
MMLU is one of the most widely used general knowledge benchmarks for LLMs. The data curation strategy for MMLU is simple: questions are sourced from freely available online sources and manually curated by graduate and undergraduate students. The benchmark contains ~16K questions divided into 57 subjects1 that span various topics like STEM, humanities, social sciences, and more. The full MMLU benchmark contains a development set of five examples per subject (i.e., used for few-shot prompting), a validation set of 1.5K questions, and the main test set. For each task, we have a minimum of 100 questions in the test set.
Data format. The questions within the MMLU benchmark use a multiple choice format, and models are evaluated using a zero or few-shot prompting strategy. Authors of the benchmark specifically avoid open-ended generation due to the increased evaluation complexity. Multiple choice correctness can be validated with string matching, allowing MMLU to be evaluated using accuracy. Several example questions from MMLU are provided below for reference.

Difficulty. Some subjects are separated into sub-tasks based on their difficulty level. More specifically, MMLU defines subjects at elementary, high school, college, and professional levels, where difficulty is inferred from the source of the questions. For example, the professional subset of the Psychology domain pulls from the exam for professional practice in Psychology, whereas the high school subset pulls from advanced placement exams (i.e., tests for high school students). Notably, not all subjects have a task for each difficulty level.
“Human-level accuracy on this test varies. Unspecialized humans from Amazon Mechanical Turk obtain 34.5% accuracy on this test. Meanwhile, expert-level performance can be far higher. For example, real-world test-taker human accuracy at the 95th percentile is around 87% for US Medical Licensing Examinations… We estimate that expert-level accuracy is approximately 89.8%.” - from [1]
As we might expect, human-level accuracy on MMLU varies significantly based on the human, domain, and level of difficulty being considered. Given that MMLU is still popular even today, several extensions have been proposed (e.g., MMLU-Pro [2] and MMLU-Redux [3]) to diagnose quality issues and to keep the benchmark from becoming saturated by newly-released LLMs over time.
“[Benchmark performance] has begun to plateau, making it increasingly difficult to discern differences in model capabilities. This paper introduces MMLU-Pro, an enhanced dataset designed to extend the mostly knowledge-driven MMLU benchmark by integrating more challenging, reasoning-focused questions and expanding the choice set from four to ten options. Additionally, MMLU-Pro eliminates the trivial and noisy questions in MMLU.” - from [2]
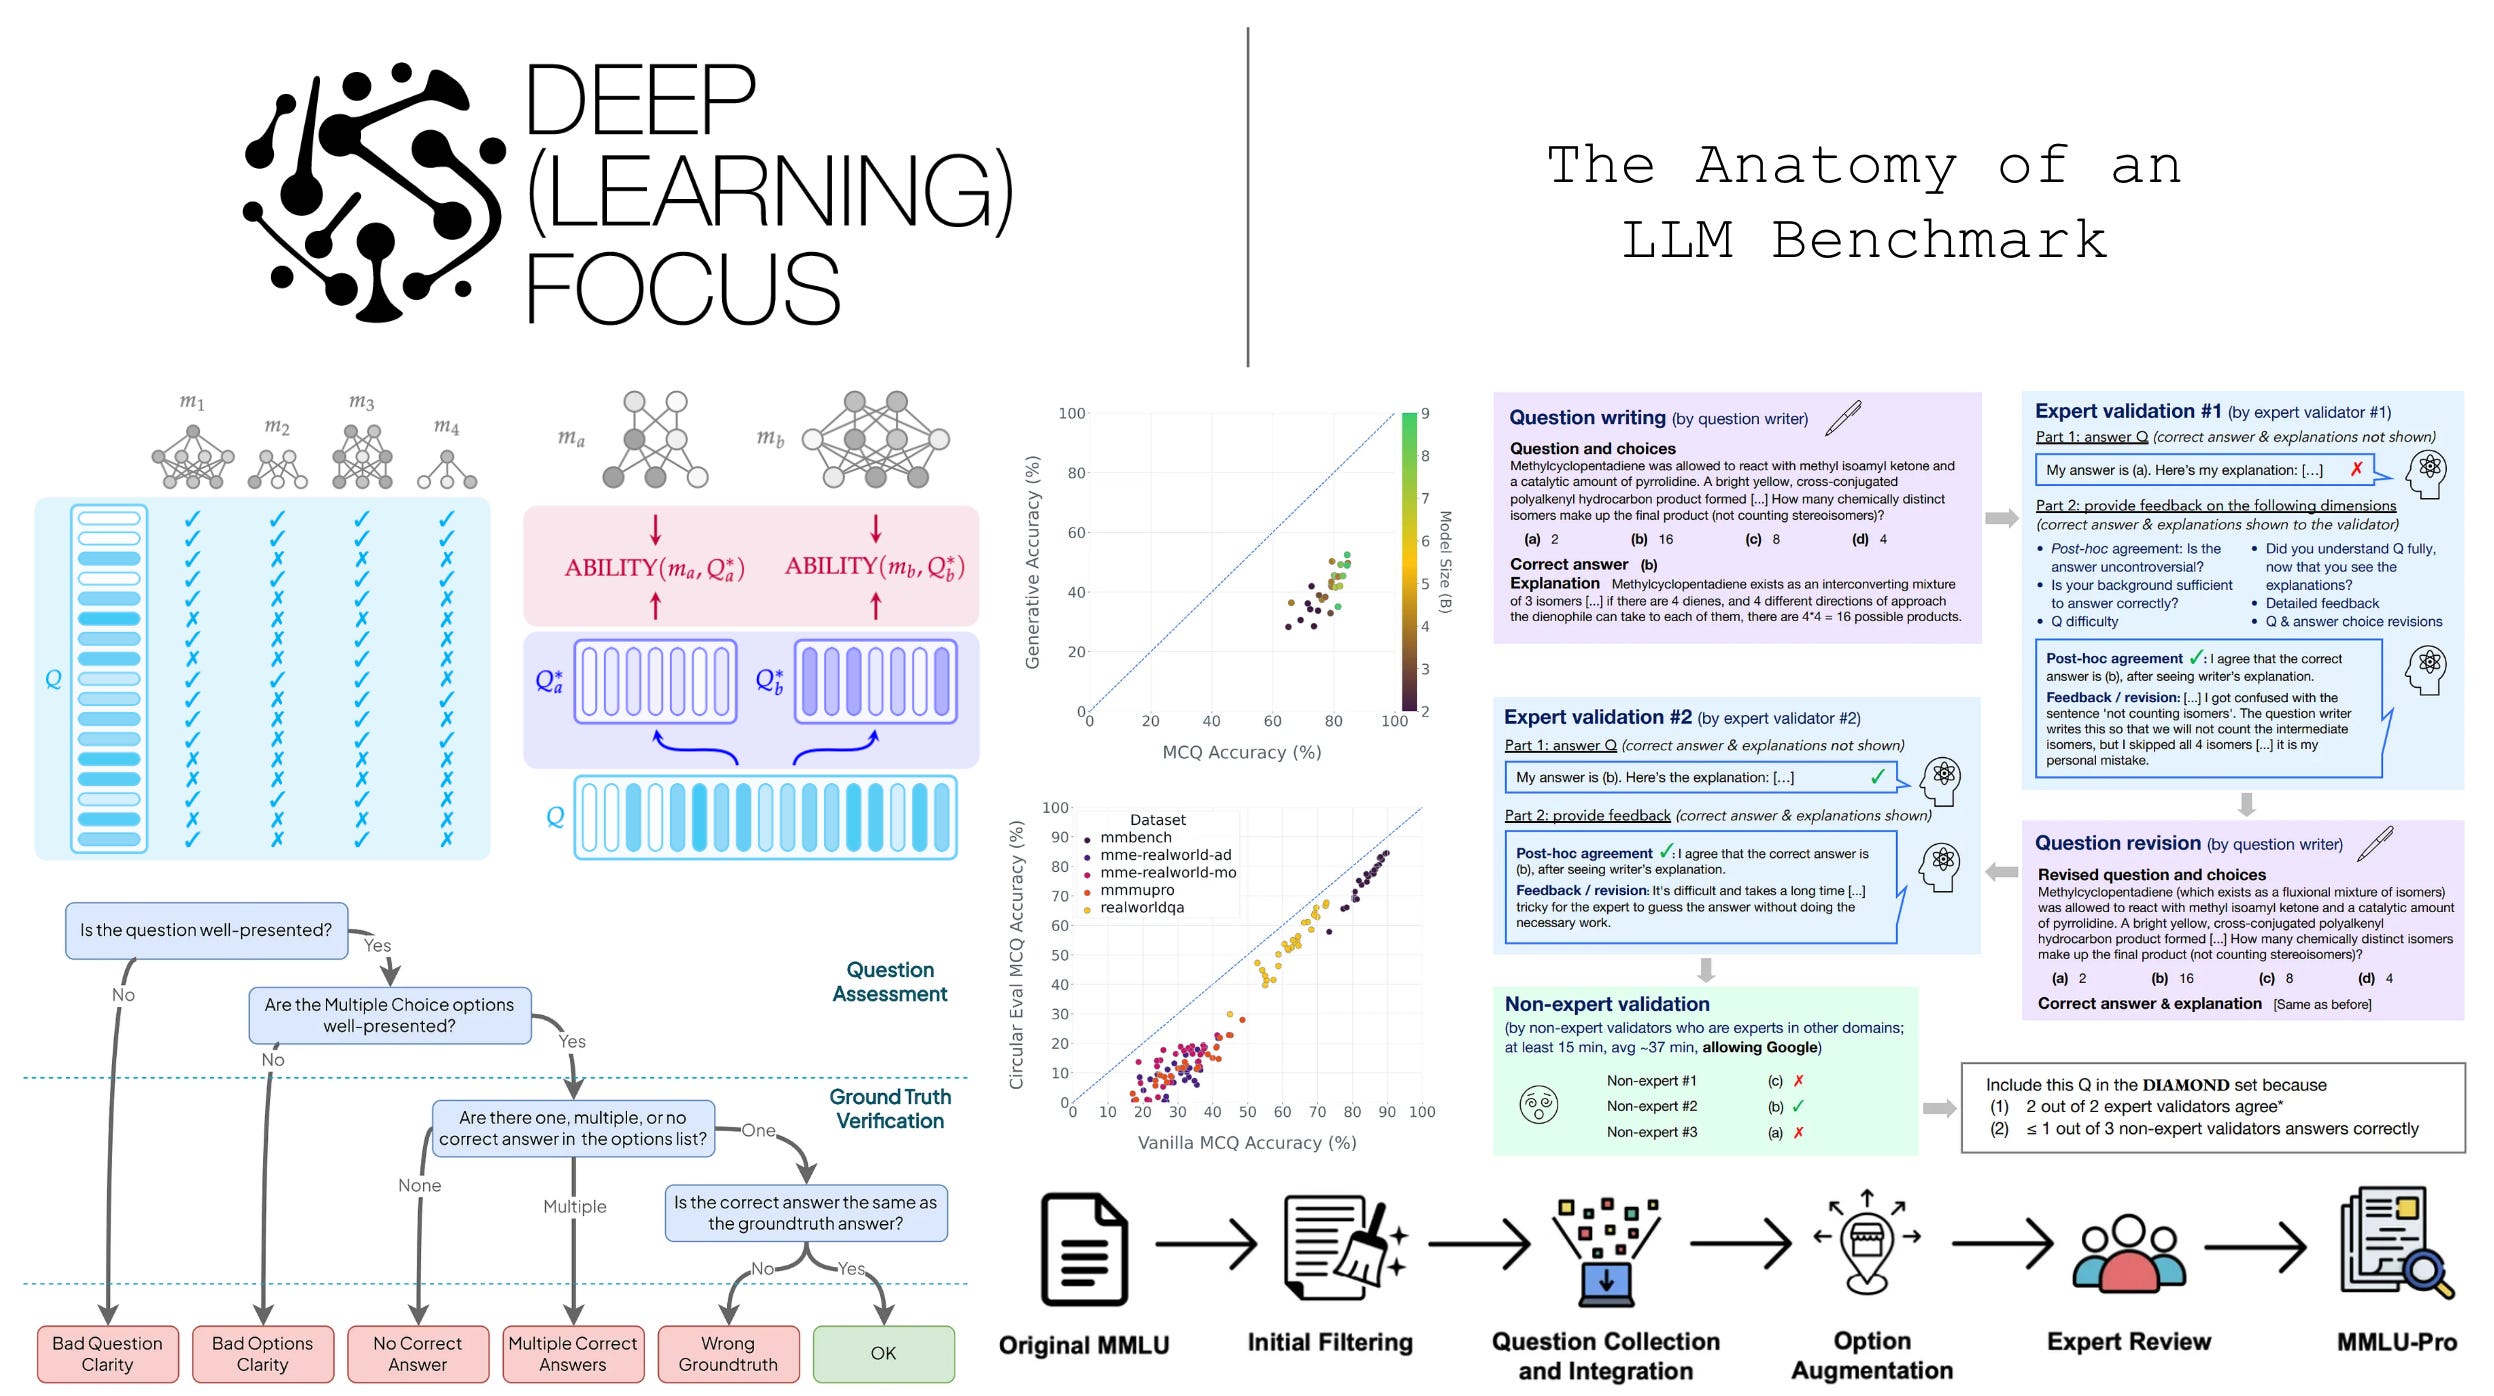
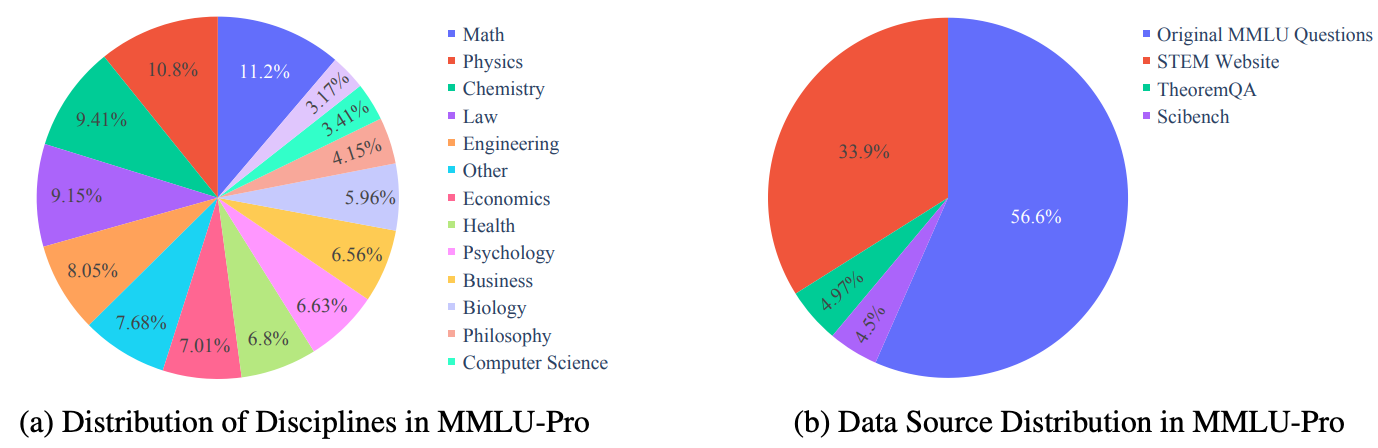
MMLU-Pro. We learn in [2] that MMLU has a non-negligible ratio of easy (i.e., knowledge-only or low reasoning) questions, as well as some questions that are flawed or incorrect. To avoid saturation and reduce noise, MMLU-Pro [2] reconstructs the benchmark in order to make it more accurate, difficult, and discriminative. The 57 subjects from MMLU are consolidated into a set of 14 broader domains, and the majority of easy questions are removed from MMLU-Pro using model-based difficulty filtering. A pool of eight models is tested on each question, and any question that the majority of models answer correctly—5,886 questions in total—is removed. From here, the remaining MMLU questions are supplemented with harder questions from sources like TheoremQA and SciBench, yielding a final benchmark of ~12K questions; see below.
For new data sources, questions are converted into a multiple choice format by asking GPT-4-Turbo to extract a correct answer and generate distractor answers. The result of this process is manually verified by asking human annotators to compare extracted answers to the original solution for each question. To reduce the impact of random guessing, the number of choices for each question is also expanded from four to ten—this is referred to as “option augmentation” in [2].
After data filtering and curation, MMLU-Pro undergoes an extensive quality control phase with multiple stages of verification by humans and LLMs. The quality control process aims to identify bad questions, incorrect answers, and false positive distractors. Human validation is performed first, then Gemini-1.5-Pro flags any remaining issues for a second stage of human review.
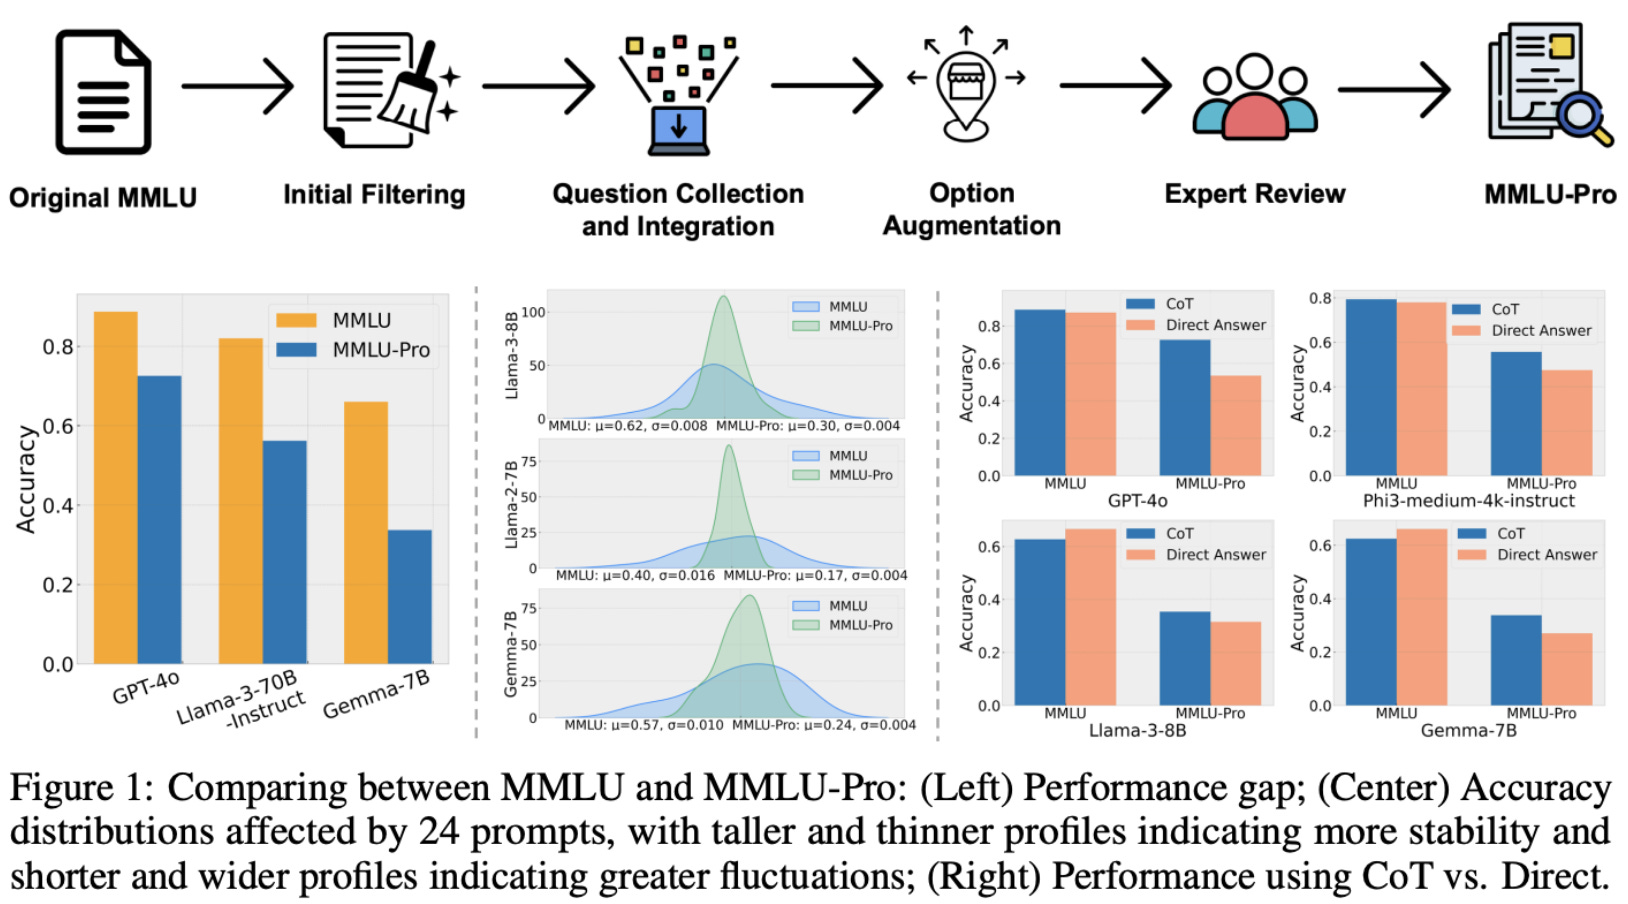
The full curation pipeline for MMLU-Pro is depicted above. MMLU-Pro still uses accuracy as the main performance metric, though we can also separately examine accuracy within each specific domain. Most LLMs perform worse on MMLU-Pro relative to MMLU—the benchmark is more difficult and has headroom before saturation—and model capability gaps tend to be more noticeable. We also see in [2] that MMLU-Pro offers improved prompt stability and benefits from advanced reasoning techniques (e.g., chain of thought prompting).
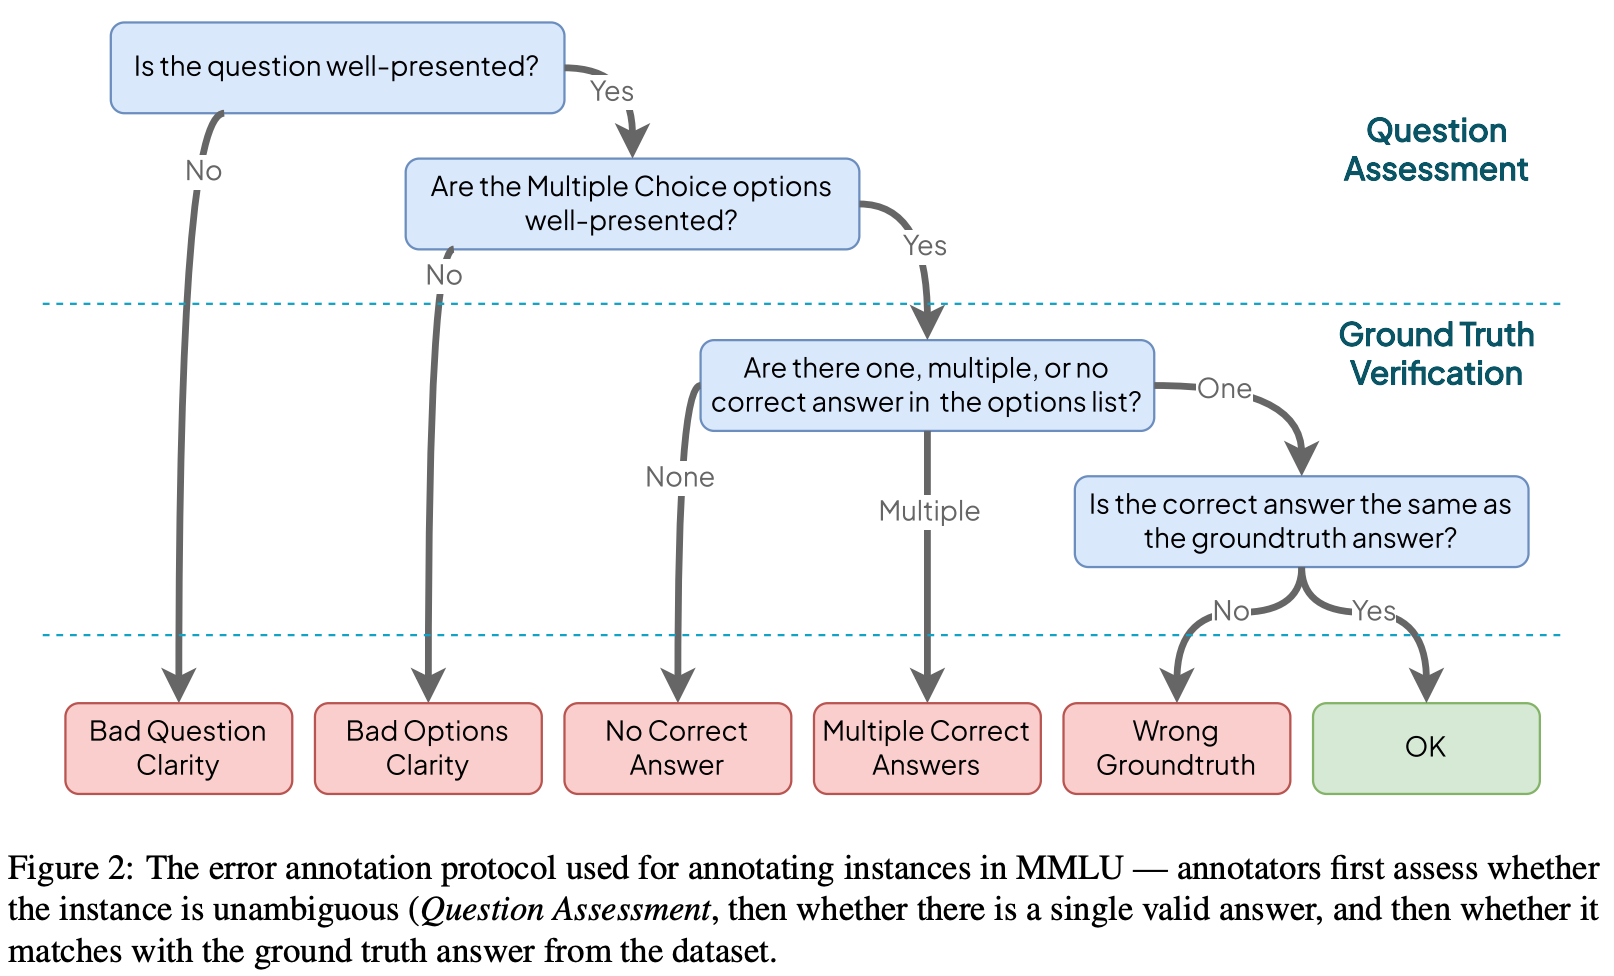
MMLU-Redux. An in-depth quality audit of the MMLU benchmark is performed in [3] over a subset of 100 questions randomly sampled from each MMLU task (i.e., 5,700 questions in total). Quality issues are categorized using a hierarchical error taxonomy; see above. This taxonomy contains five error categories that are used to granularly categorize questions with poor quality or incorrect ground truth. When necessary, questions are re-annotated and verified according to the original source material or, when the original source is absent, a trusted source (e.g., government websites). We see in [3] that an estimated 6.49% of MMLU questions contain errors, but the ratio of errors varies between subjects; e.g., 57% of Virology questions were flagged due to quality issues; see below.
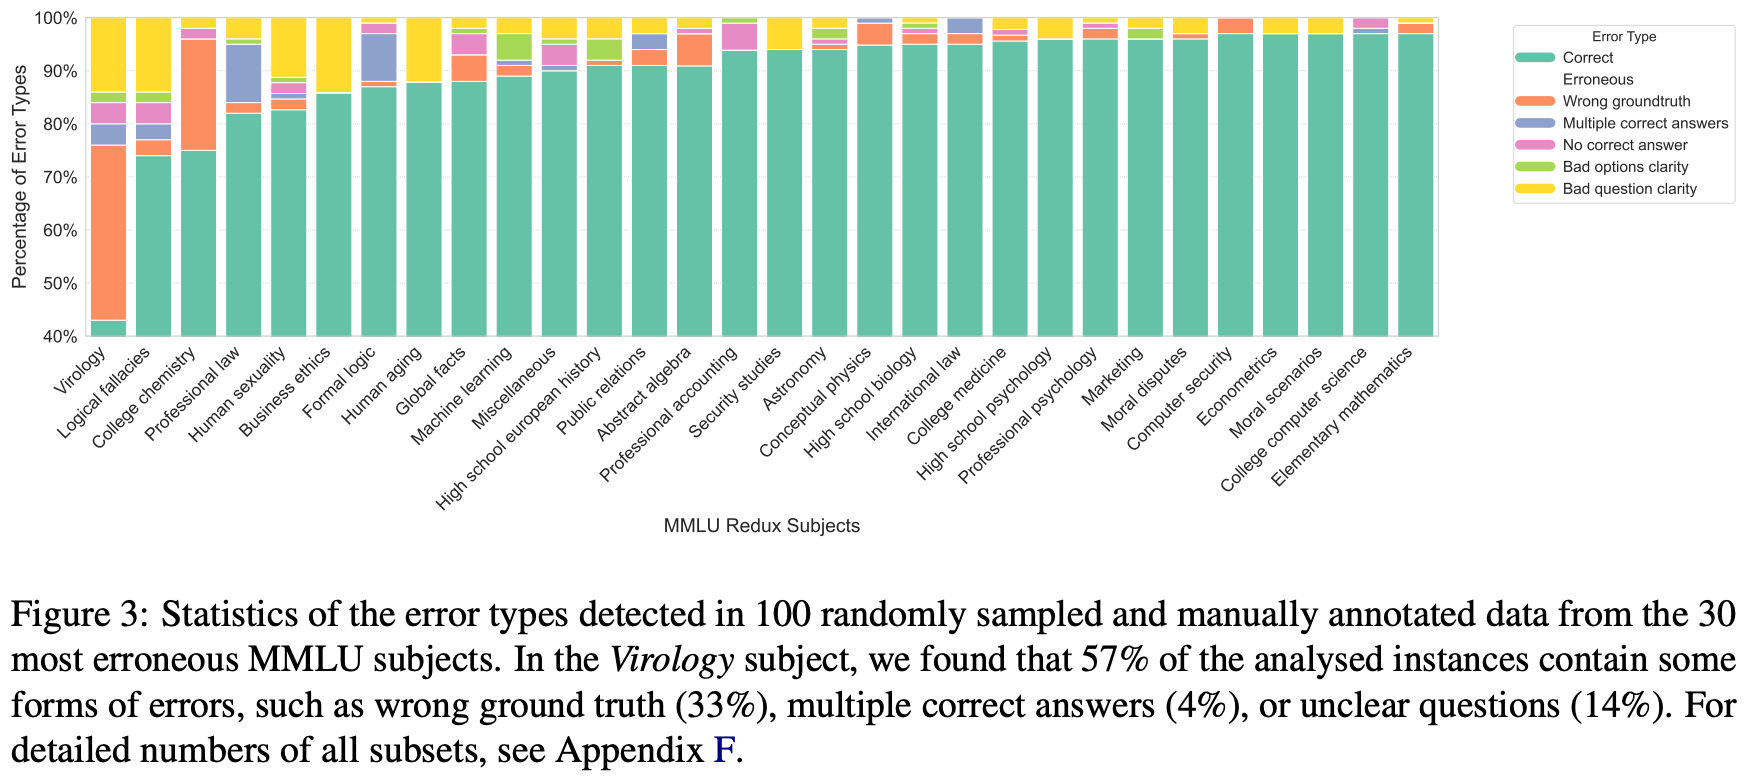
The result of this sampling and re-annotation procedure is MMLU-Redux, a subset of 5,700 manually inspected MMLU questions. For several high-error subjects, authors monitor agreement across three separate annotators using Cohen’s Kappa. Re-annotation agreement is found to be strong even on difficult subjects, providing confidence in the quality of the human-audited data. The aim of this effort is not to produce a harder version of MMLU but rather to audit (and fix or discard) existing questions for quality and accuracy—MMLU-Redux is an updated subset of MMLU that can be adopted for more reliable evaluation.
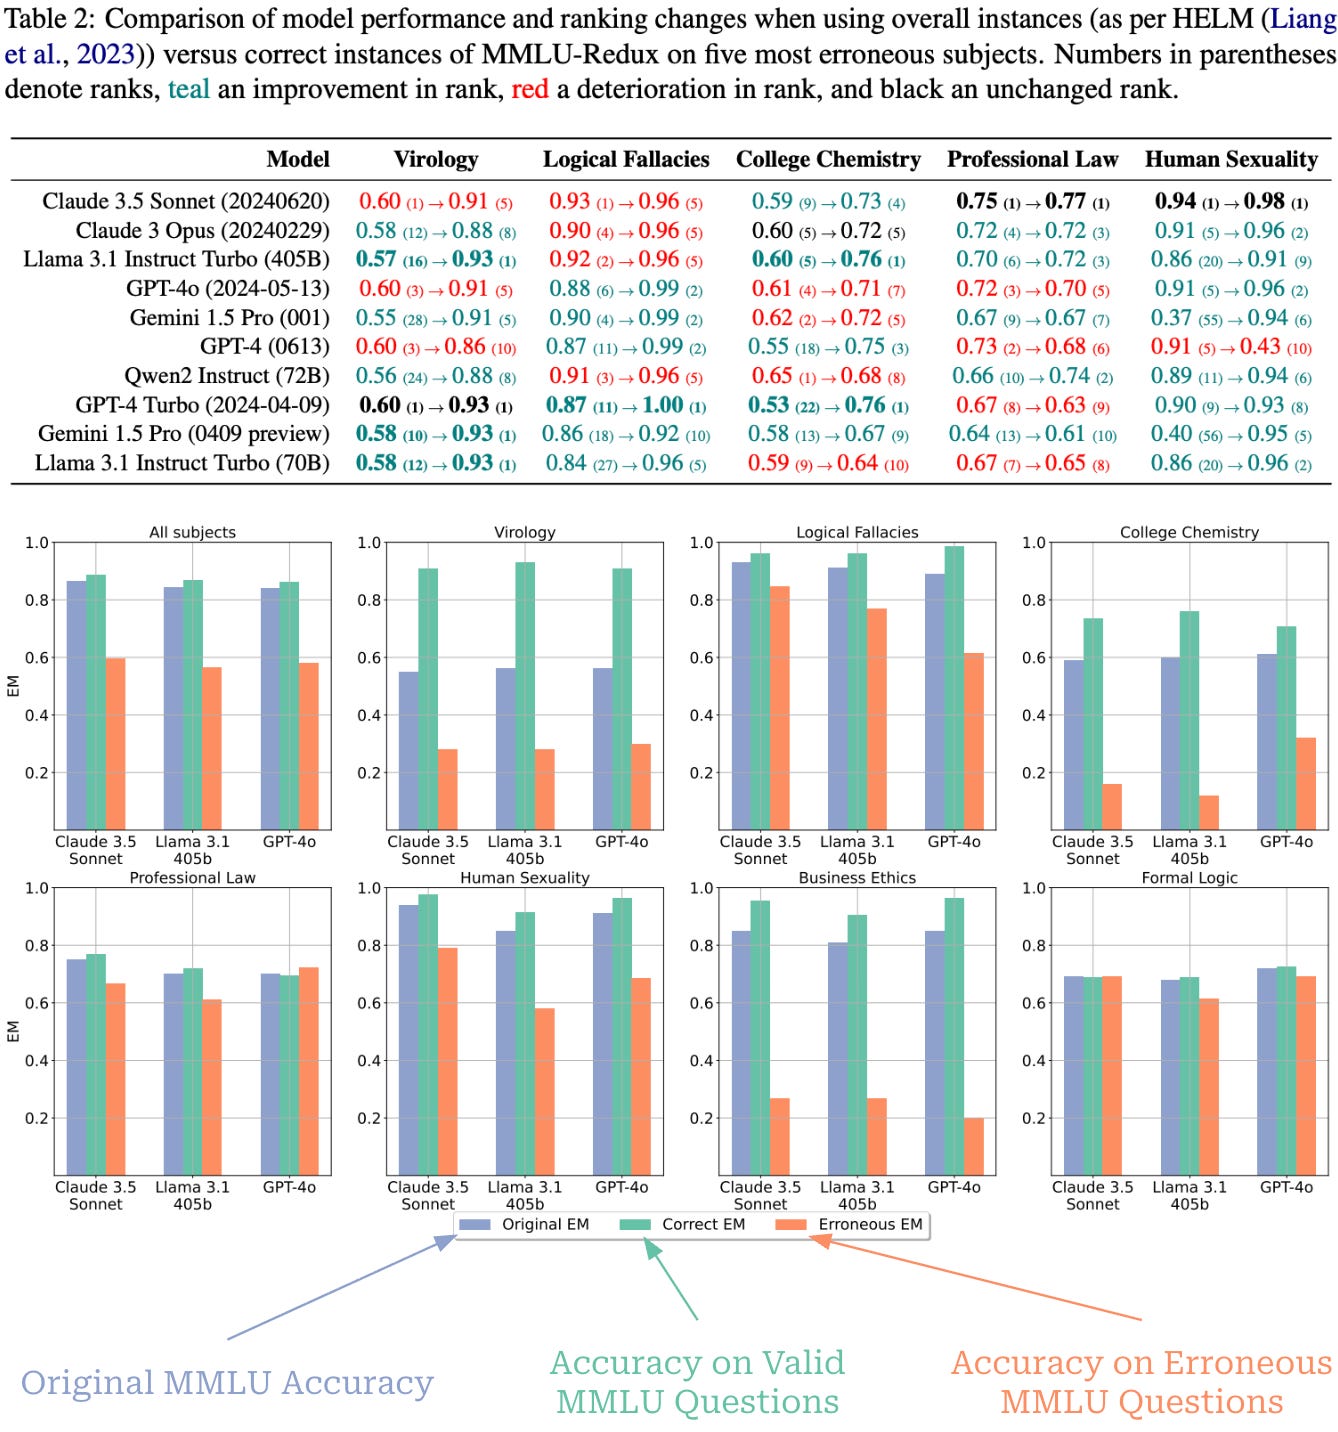
We see in [3] that removing incorrect evaluation data meaningfully impacts performance and model rankings; see below. For example, Llama-3.1-405B improves from 16th to first in rank for Virology and Qwen-2-72B-Instruct drops from first to eighth place for College Chemistry when only evaluating on correct instances from MMLU-Redux—these results suggest improved reliability.
GPQA: A Graduate-Level Google-Proof Q&A Benchmark [4]
GPQA is another popular LLM benchmark that takes a different approach from MMLU. Namely, GPQA is a much smaller dataset: the extended version contains 596 questions, while the main and diamond subsets contain 448 and 198 questions, respectively. Rather than providing broad coverage, GPQA focuses on curating a small number of expert-verified questions that are difficult to solve even with internet access (i.e., a “Google-proof” benchmark). Three primary domains are covered—Biology, Chemistry, and Physics—each of which is divided into several sub-domains2. Similarly to MMLU, however, GPQA does adopt a multiple choice question format with four answers per question.
“We present GPQA, a challenging dataset of 448 multiple-choice questions written by domain experts in biology, physics, and chemistry. We ensure that the questions are high-quality and extremely difficult: experts who have or are pursuing PhDs in the corresponding domains reach 65% accuracy (74% when discounting clear mistakes the experts identified in retrospect), while highly skilled non-expert validators only reach 34% accuracy, despite spending on average over 30 minutes with unrestricted access to the web (i.e., the questions are “Google-proof”).” - from [4]
Expert curation. The data from GPQA is manually curated by a group of 61 human experts that each have—or are pursuing—a PhD in a relevant field. The data curation pipeline for GPQA is depicted below. To begin, experts in each domain write a set of candidate questions. These questions are written from scratch, rather than being collected from existing exams or datasets. As a guiding principle, experts are specifically asked to write questions that are:
Difficult.
Answerable by experts in the same domain.
Not possible for non-experts to answer, even with internet access.
Questions are always written such that they can be answered with or without choices being presented, thus enabling GPQA to be easily extended to an open-ended generation format in the future. In addition to writing each question, a written explanation is provided for both the answer and all distractors.
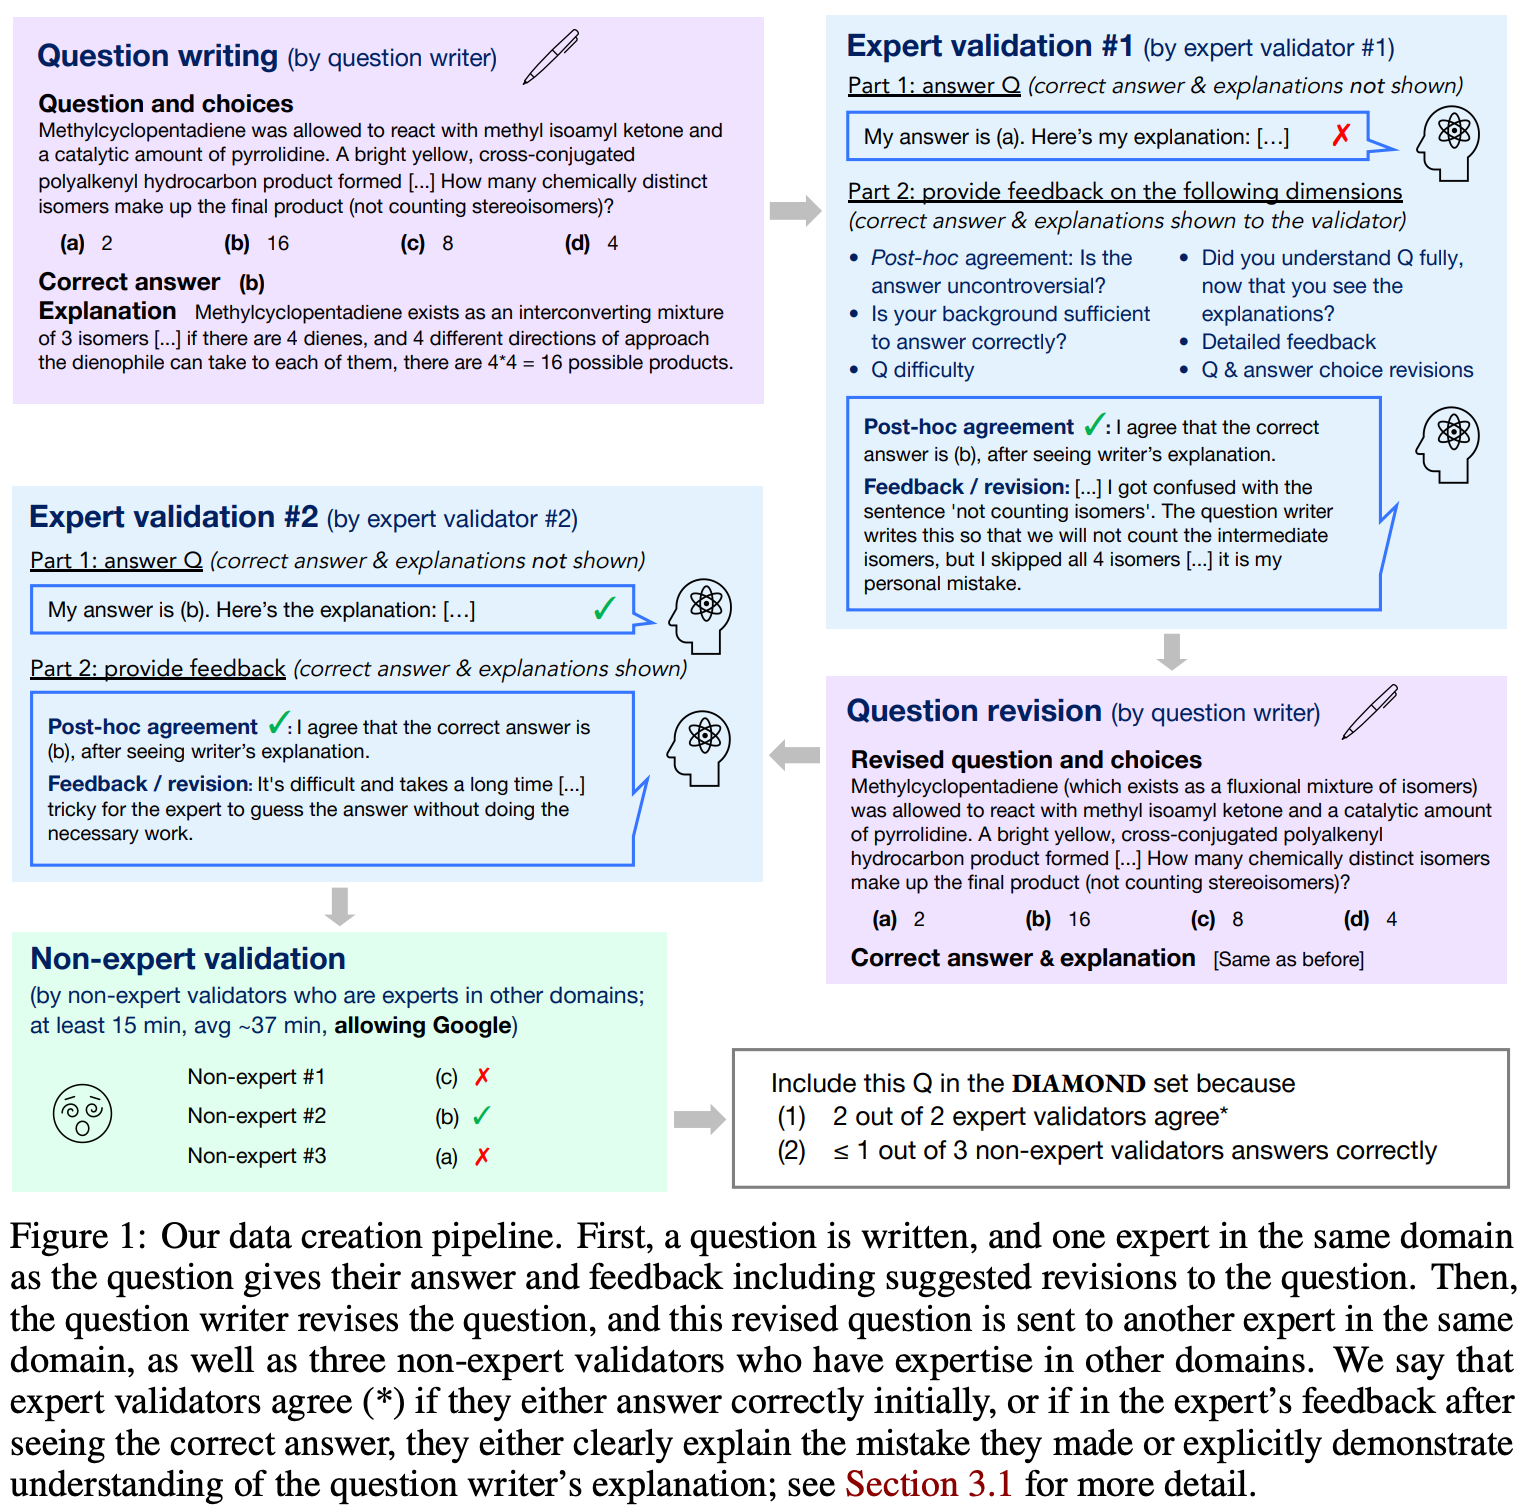
After a question is written, two separate domain experts interact with it. The first expert solves and validates the question, then suggests possible revisions. After the writer revises the question based on suggestions, a second domain expert answers the revised question. Finally, three different non-expert validators—selected from the group of experts for other, non-overlapping domains—try to answer the question with unrestricted internet access, spending a minimum of 15 minutes and nearly 40 minutes on average answering each question.
“The process consists of four main stages: question writing, expert validation, question revision, and non-expert validation.” - from [4]
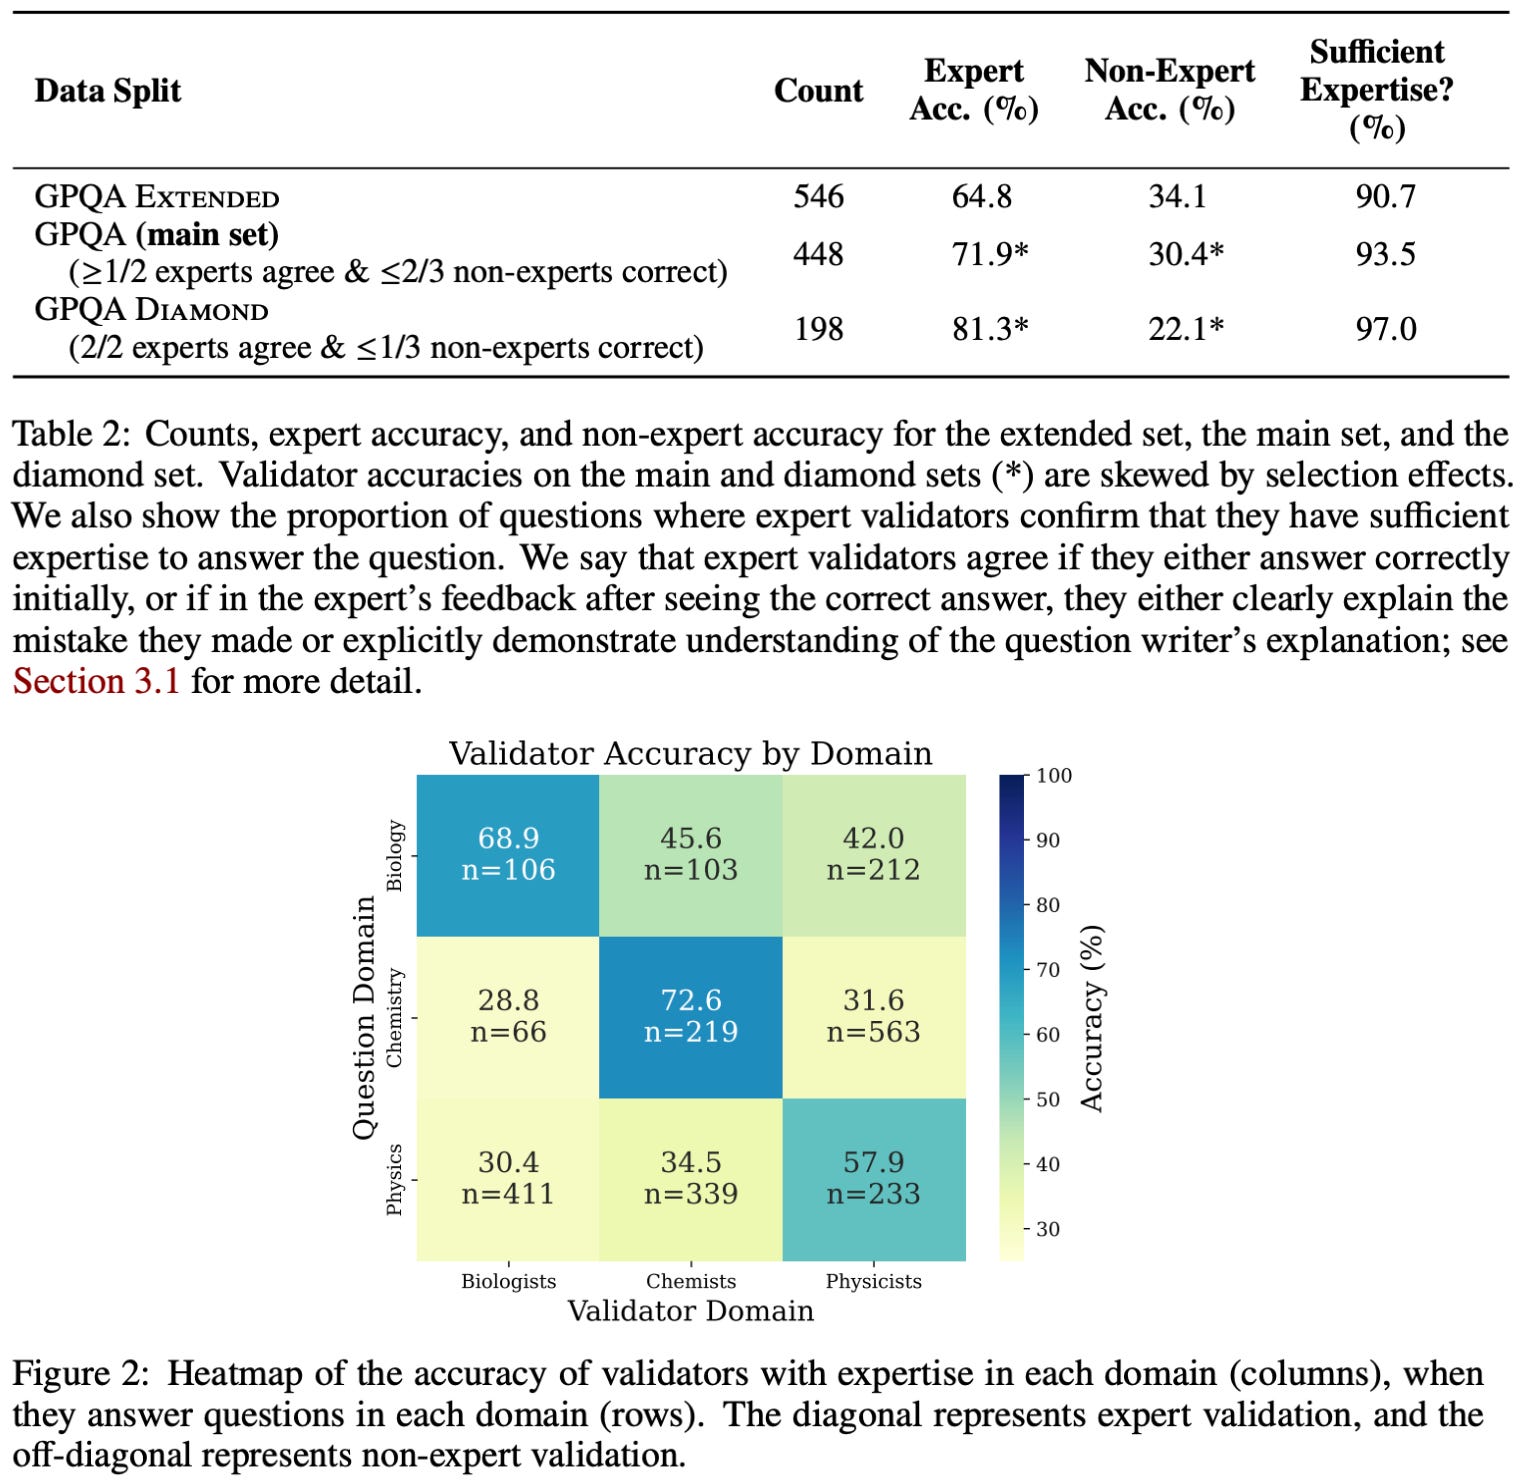
Verification principles. The GPQA curation process validates both correctness and difficulty. Correctness is handled via expert validation and revision, while difficulty is assessed based on the ability of non-experts to solve questions. The results of these two stages are used to define the different subsets of GPQA:
GPQA Extended: full dataset (546 questions).
GPQA Main: questions where at least one expert agrees with the answer and at most two non-experts answer the question correctly (448 questions).
GPQA Diamond: questions where both experts agree with the answer and at most one non-expert answers the question correctly (198 questions).
As shown below, the resulting subsets are quite difficult, with experts achieving around 70-80% accuracy and non-experts a much lower accuracy of 30-40%.
Beyond the Imitation Game Benchmark (BIG-Bench) [5]
“BIG-bench… includes a set of 204 or more language tasks. As reflected in the BIG-bench review criteria, benchmark tasks are novel, cover a diverse range of topics and languages, and are not fully solvable by current models.” - from [5]
BIG-Bench explores a community-based strategy for curating difficult LLM evaluation tasks. The benchmark was openly constructed on Github, where researchers were asked to contribute tasks by creating a pull request. Each task was then manually reviewed in a corresponding PR discussion according to detailed submission criteria; e.g., correctness, difficulty, decontamination, and justification (i.e., why is this an important task for LLMs to solve?). The version of BIG-Bench outlined in [5] contains 204 tasks that were curated by 405 authors. The set of included tasks is incredibly broad, covering topics like math, coding, reasoning, science, and more; see here for a summary of task domains.
Task interface. Unlike the benchmarks we have seen so far, BIG-Bench does not have any unified data format—tasks have varying formats ranging from multiple choice to open-ended generation and multi-turn (interactive) chat. In order to handle the diversity of tasks present in BIG-Bench, authors introduce a standard API structure that is used by all tasks. This API specifies two task types:
JSON: defined by a JSON file containing a list of input-output examples.
Programmatic: defined by a Python function that can interact directly with the model over multiple chat turns and compute custom metrics.
By using these standardized structures for all tasks, we can easily evaluate any public model or onboard new tasks with minimal implementation changes. The distribution of BIG-Bench tasks follows an 80-20 split between JSON and programmatic task types. In programmatic tasks, we interact with the model via two standard functions:
generate_text: generate a text continuation from the model.cond_log_prob: compute log probabilities of a target given input.
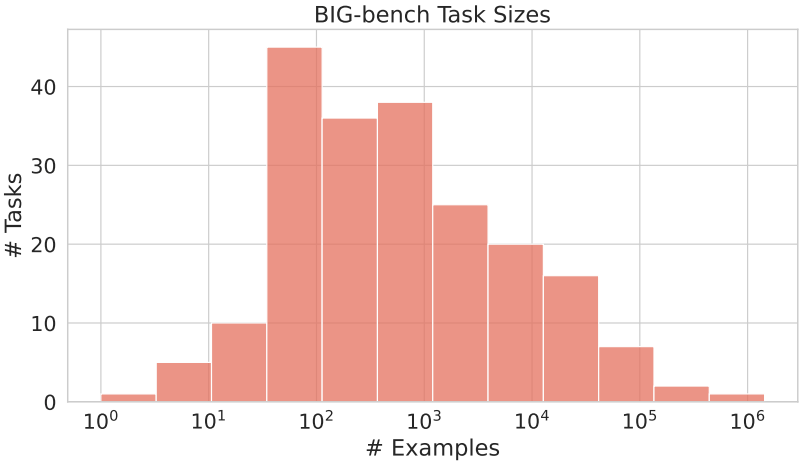
The model can be queried multiple times within a programmatic task, enabling support for multi-turn chat or iterative tasks within BIG-Bench. Each task must have a minimum of 32 evaluation samples, though authors are encouraged to create much larger tasks; see below for a distribution of task sizes.
Performance metrics. Given that BIG-Bench tasks follow a variety of formats, we cannot evaluate all tasks with a unified performance metric like accuracy. Instead, a suite of standard metrics is provided for all tasks, and programmatic tasks are even allowed to define their own custom metrics. In [5], authors list the following performance metrics as being used in BIG-Bench:
Exact String Match.
Multiple Choice Accuracy.
Multi-Category Brier Score: evaluates the calibration—a measure of how well confidence3 aligns with observed correctness—of a model’s outputted probabilities on options for a multiple choice question.
Expected Calibration Error: another calibration metric that measures how well the model’s accuracy matches the probability assigned to a response in the multiple choice setting.
Interestingly, BIG-Bench even allows multiple evaluation metrics to be defined per task, but one metric must be defined as the primary metric. Additionally, each task must specify a high and low reference score on the primary metric. Using this information, we can normalize each task’s preferred metric using the high and low reference scores. Then, we can compute aggregate performance over the entire benchmark by averaging normalized metrics across tasks—this approach summarizes benchmark performance with a single score in the range [0, 100].
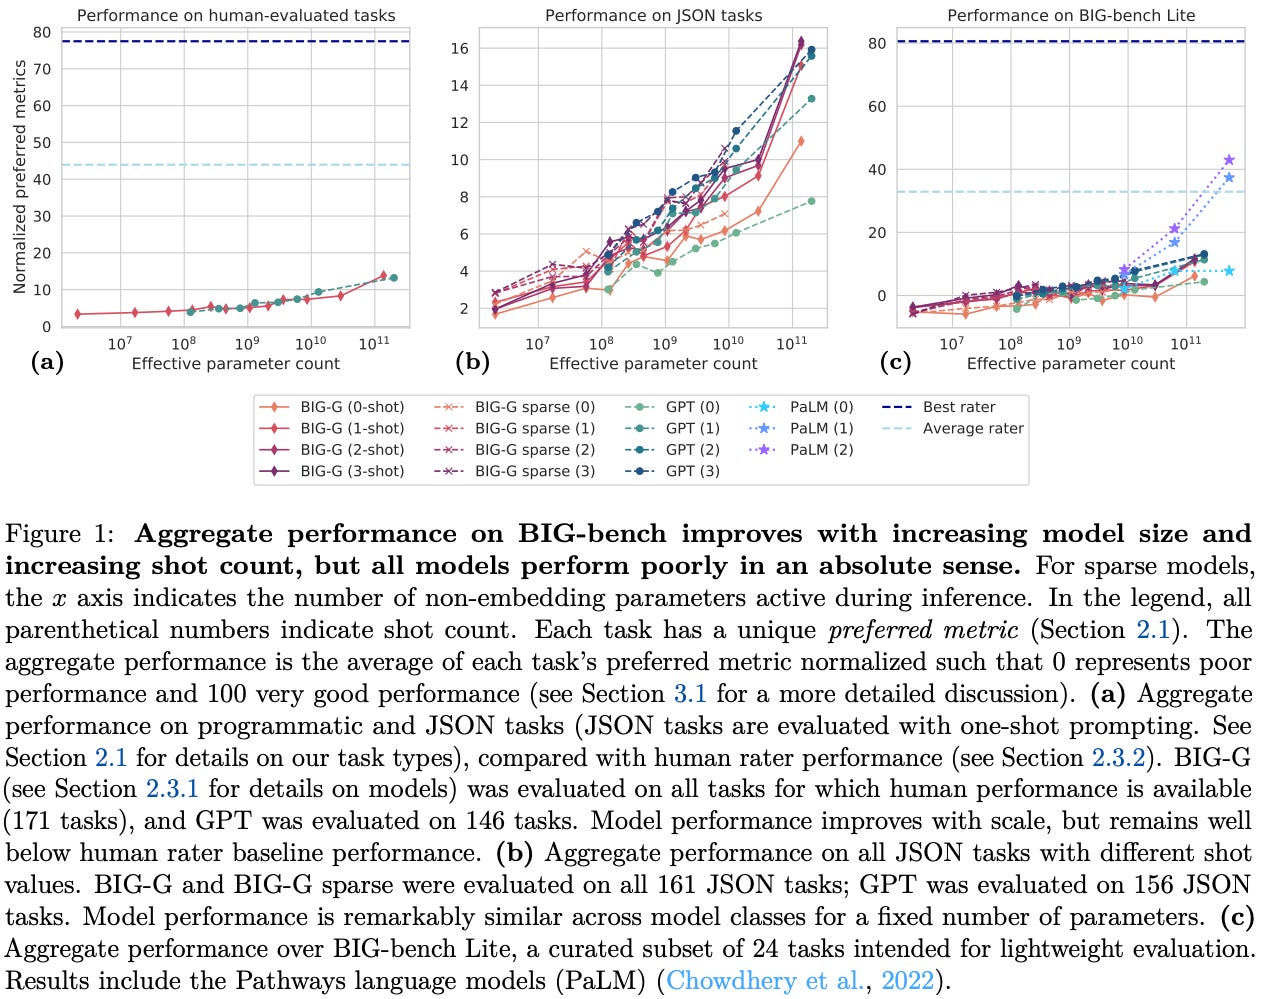
As shown above, all models at the time of BIG-Bench’s proposal performed well below human baseline performance; see above. Although performance improves with model scale, all models perform poorly in an absolute sense, indicating that the benchmark was quite difficult to solve for models at that time. Human performance metrics in the above plot—reported as both a max and mean score across multiple annotators—were collected using a team of expert annotators that were given full internet access. However, properly measuring human performance is difficult given the breadth of tasks present in BIG-Bench.
“While we report mean and max human rater scores for all tasks evaluated by raters, care must be taken when interpreting these metrics. We do not claim that these scores are the best possible achievable by a human, or even that these scores are the best achievable by these particular evaluators… For example, if a task requires knowledge of programming, how do we weight scores of evaluators who do not know how to program?” - from [5]
BIG-Bench Lite. The size and breadth of BIG-Bench makes it computationally expensive to run. To solve this, authors in [5] provide a smaller task subset, called BIG-Bench Lite, to use for faster evaluation. This subset is made up of 24 JSON-style tasks that are chosen via a manual selection process that considers task diversity and inclusion of specific task types (e.g. coding or non-English tasks).
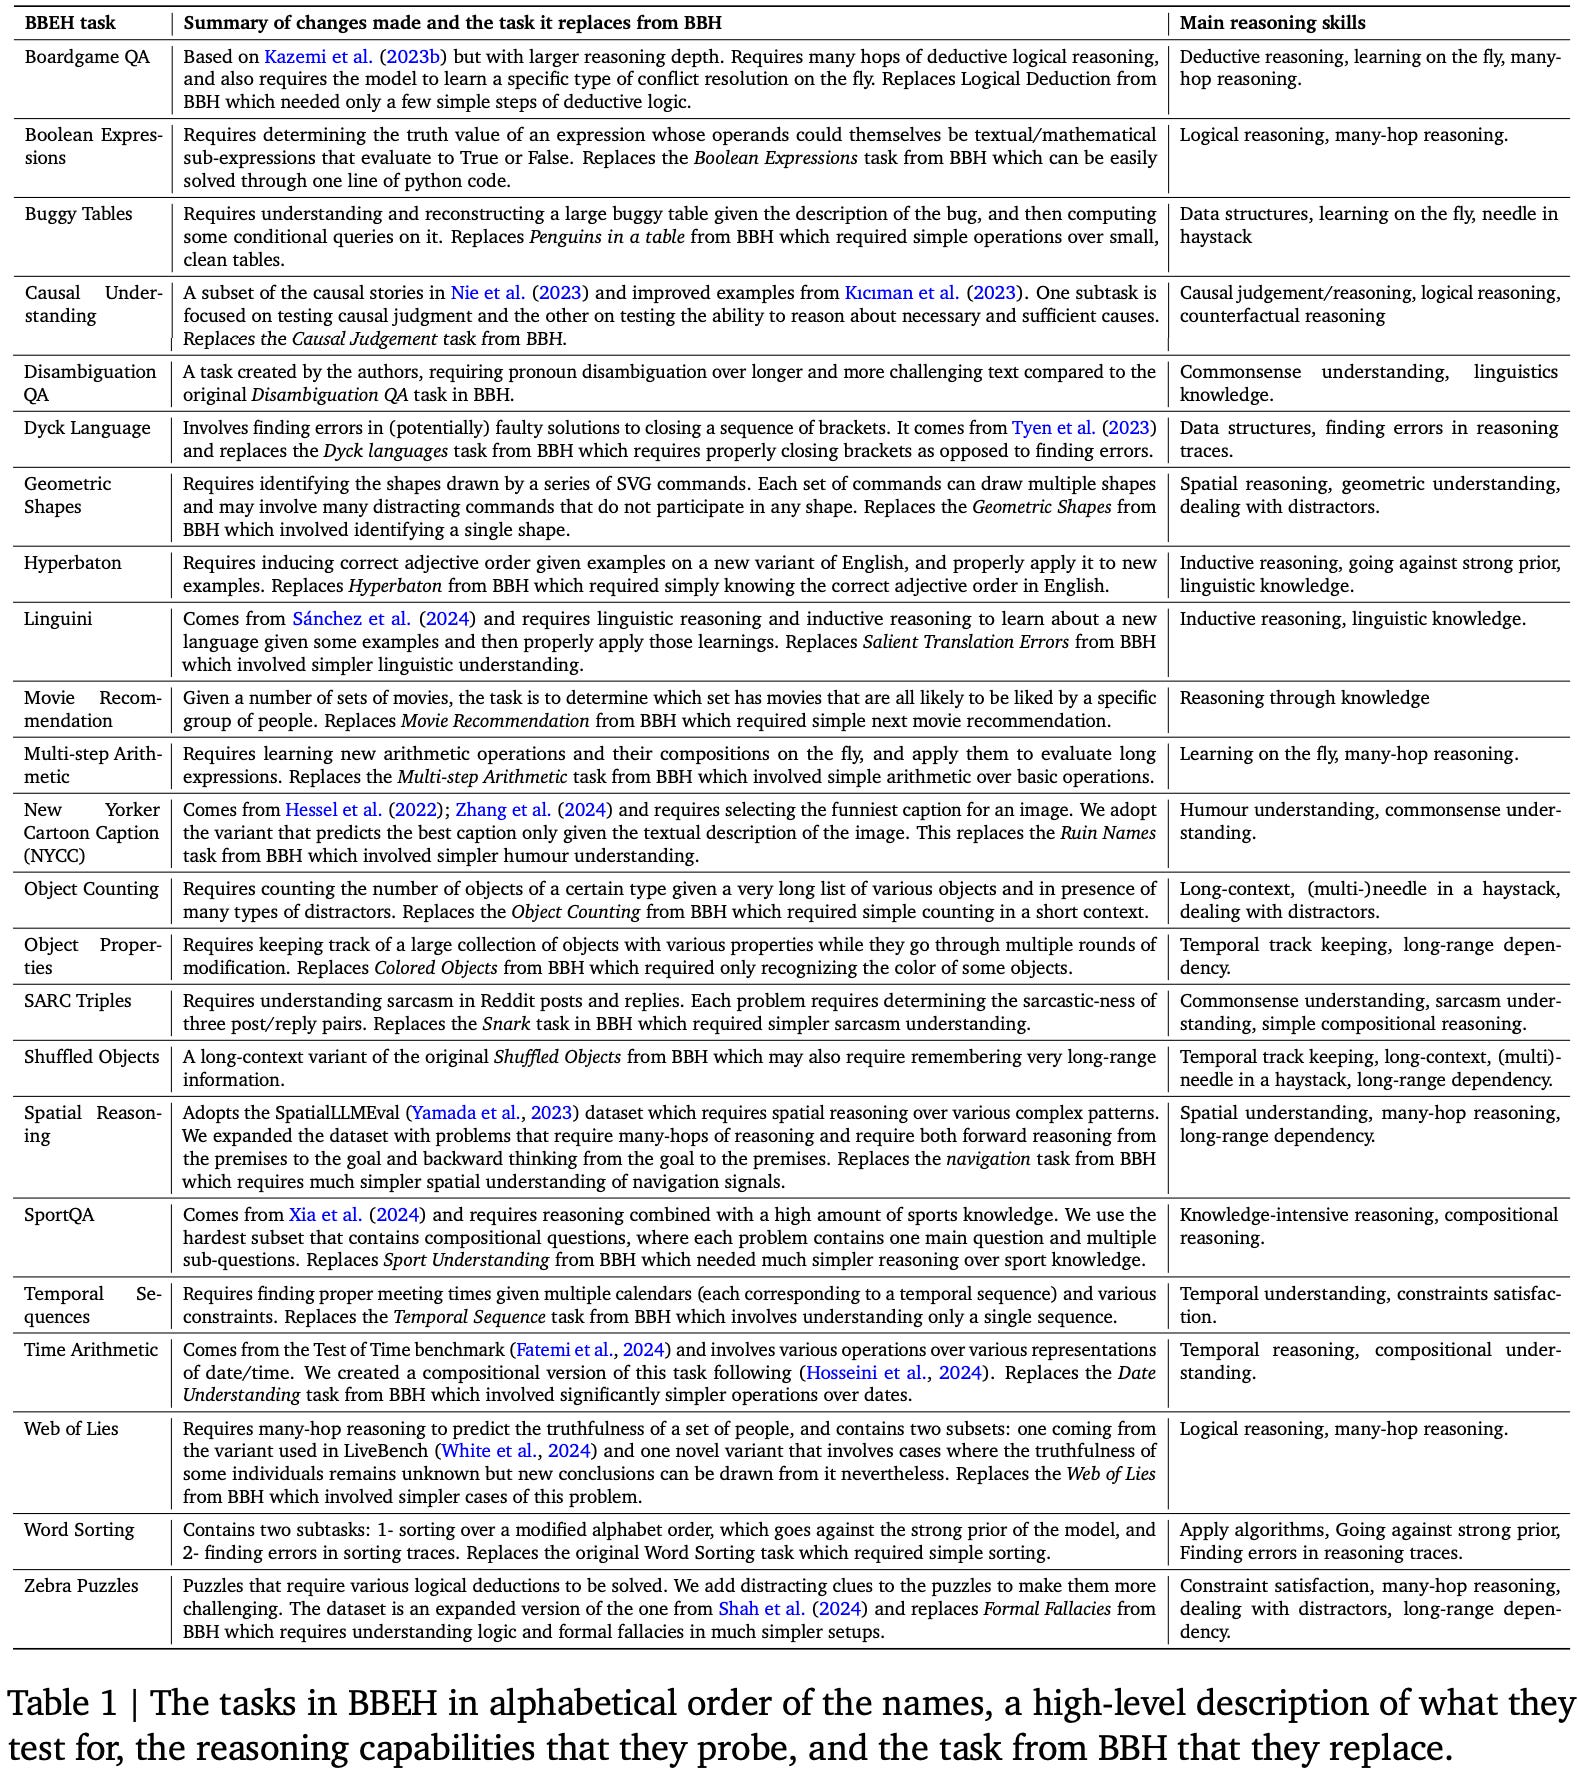
BIG-Bench Hard (BBH). Less than a year after the release of BIG-Bench, LLMs had already begun to surpass average human performance on the majority of tasks. BIG-Bench Hard [6], a difficult subset of the BIG-Bench dataset, was created in response to these quick improvements in capabilities. The steps used to select the tasks within BIG-Bench Hard are outlined in the table below.
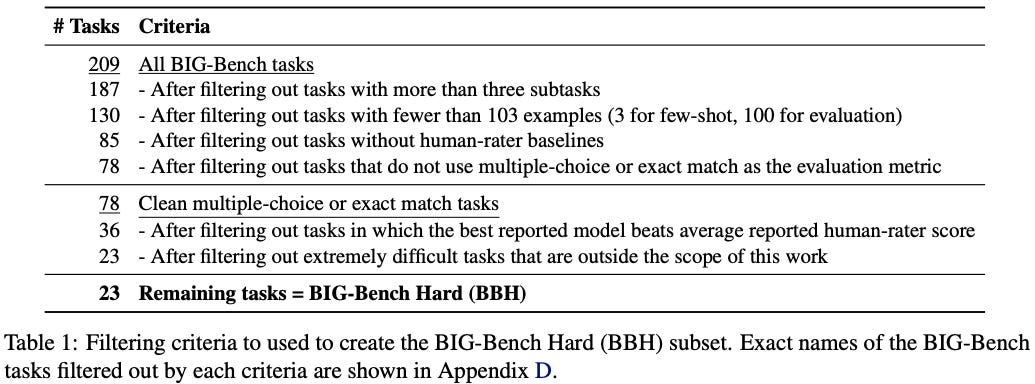
All tasks in BIG-Bench Hard are derived from BIG-Bench. Initially, tasks are filtered according to several heuristics; e.g., not containing too many subtasks, having too few evaluation examples, or using evaluation metrics beyond multiple choice or exact match accuracy. Any task without a human performance baseline is also removed, and the remaining task subset is further refined by only retaining tasks where models underperform humans. From here, tasks are then manually inspected to remove any tasks that are overly difficult or out of scope4, leaving us with the final set of 23 tasks in BIG-Bench Hard; see below.
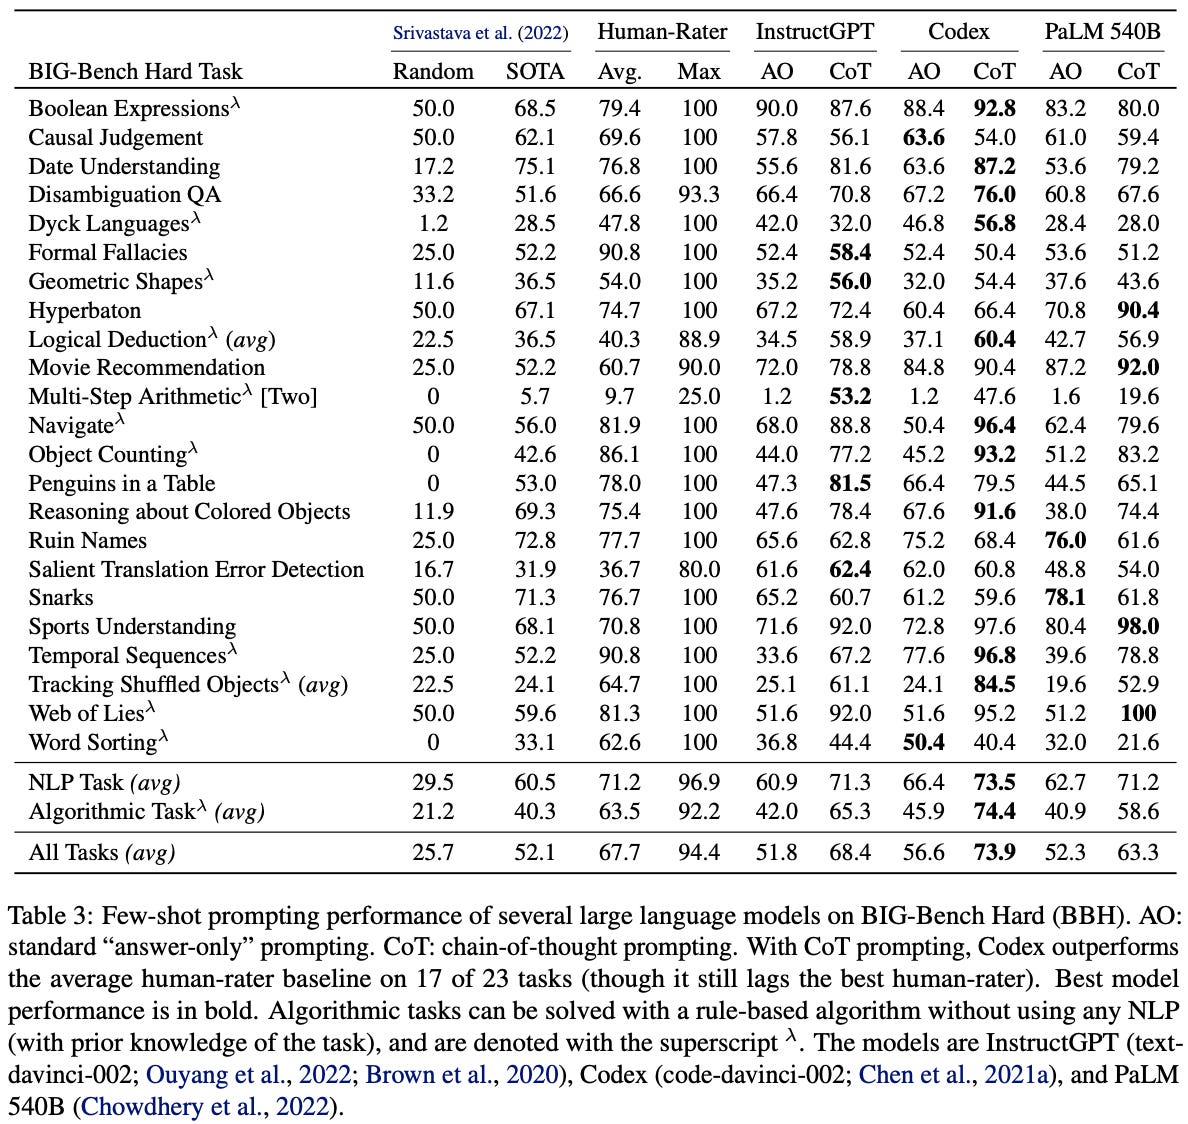
Despite focusing on a much smaller set of difficult tasks—about 10% of the original benchmark—that have a standard format, BIG-Bench Hard is mostly able to maintain the breadth of BIG-Bench. The tasks present in BIG-Bench Hard can be roughly categorized into natural language (e.g., detecting translation errors or recommending movies) and algorithmic (e.g., evaluating boolean expressions or performing multi-step arithmetic) tasks. When examining model performance on BIG-Bench Hard, we see that the models considered in [6] usually surpass average human performance but fall short of the best performance of a human. However, the best LLMs today achieve almost perfect accuracy on BIG-Bench Hard.
Given that BIG-Bench is constructed as a community effort, benchmark tasks have a high level of variance—cleanliness and quality fluctuate, and each task may have different metadata. Tasks are selected based on both quality and difficulty by using a combination of heuristics and manual inspection. Additionally, BIG-Bench Hard restricts the benchmark to tasks that use an exact match or multiple choice format. This choice is made to simplify the analysis of chain of thought prompting by enabling the use of a unified prompt format across different tasks. In this way, BIG-Bench Hard does not solely maximize difficulty—it identifies a subset of hard tasks that also work well with chain of thought prompting.
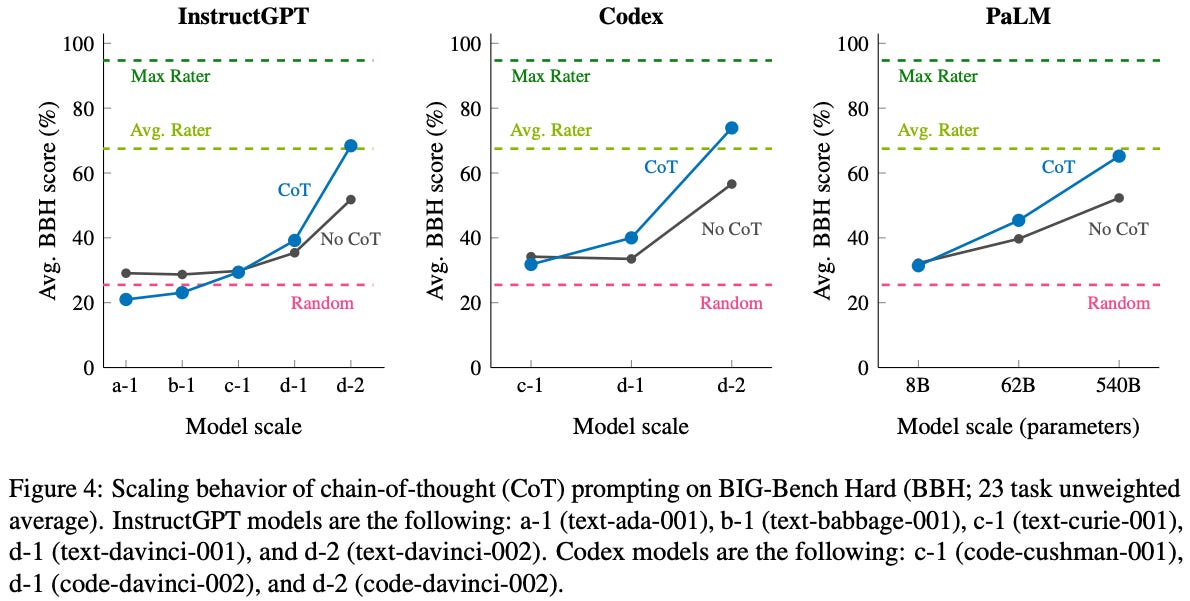
As shown above, several top models at the time of release for BIG-Bench Hard noticeably underperform the average human baseline. This gap can be closed in many cases via chain of thought prompting, but benchmark performance still falls short of maximum human performance for even the largest models.
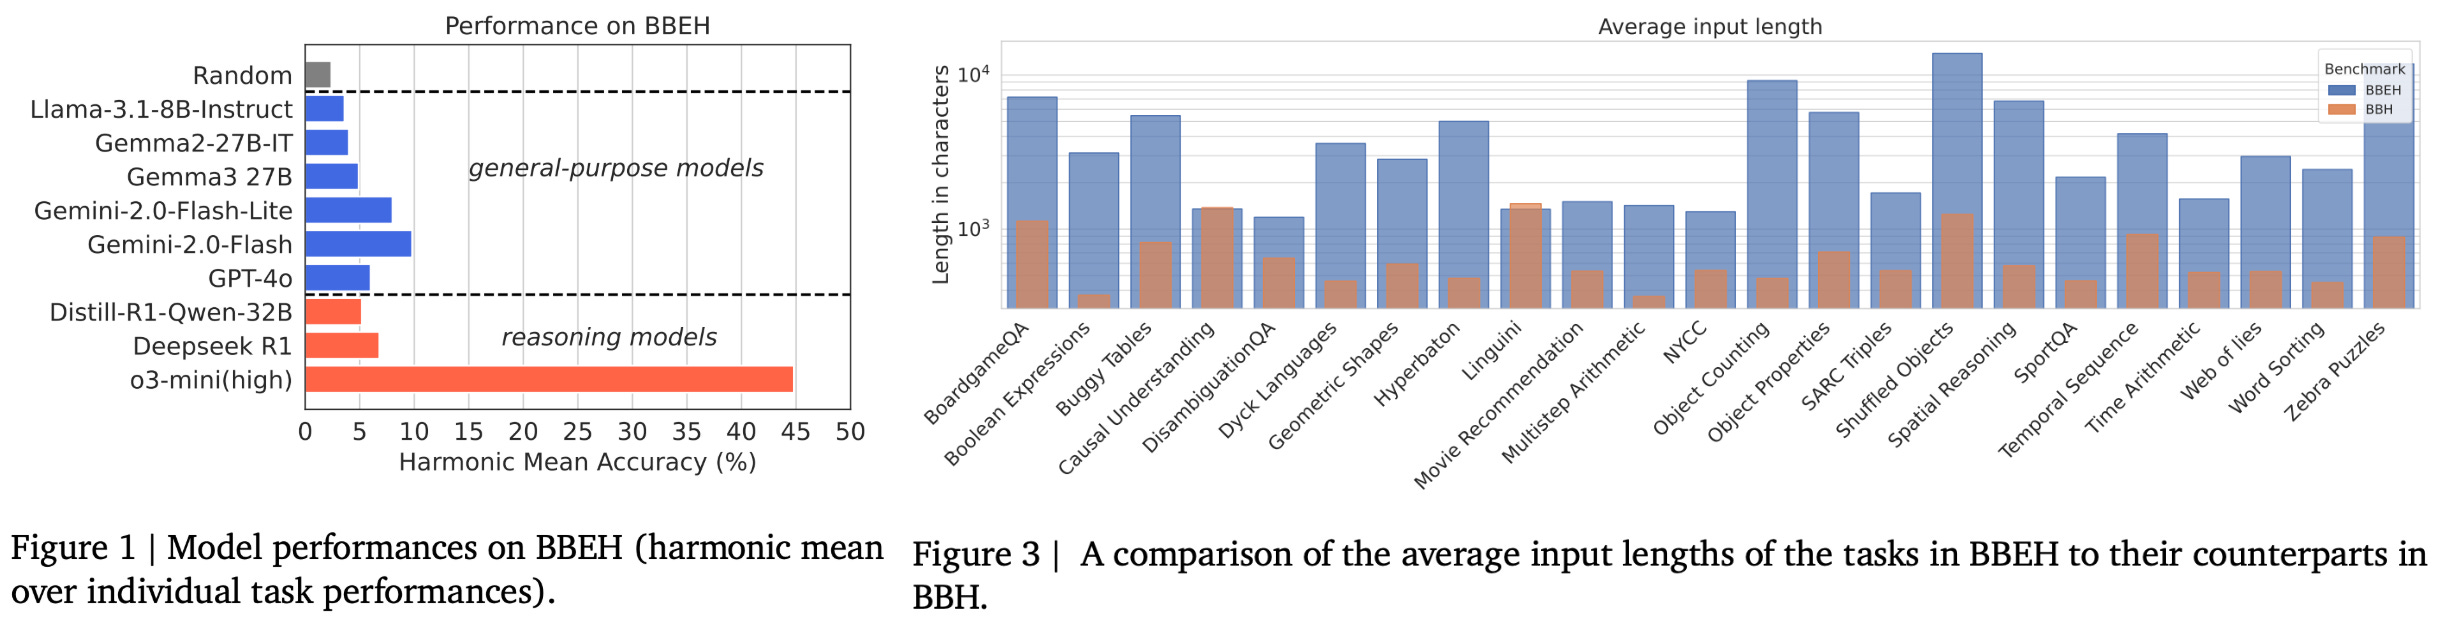
BIG-Bench Extra Hard (BBEH). The BIG-Bench family is one of the few reasoning-focused evaluation suites that prioritizes general reasoning rather than math and coding. However, both BIG-Bench and BIG-Bench Hard were saturated by early 2025, with top reasoning models achieving nearly perfect scores on both benchmarks. As a solution, BIG-Bench Extra Hard was created by replacing each of the BIG-Bench Hard tasks with a corresponding task that tests a similar category of reasoning capabilities but is significantly more difficult.
“BIG-Bench Extra Hard replaces each task in BIG-Bench Hard with a novel task that probes a similar reasoning capability [with] increased difficulty.” - from [5]
Examples of new reasoning skills tested by BIG-Bench Extra Hard include many-hop reasoning, long context reasoning, properly handling distractors, finding errors in reasoning traces, reasoning under constraints, and more. To perform well on BIG-Bench Extra Hard, models must command a breadth of different reasoning capabilities. An itemized list of the reasoning tasks present in BIG-Bench Extra Hard is provided in the figure below. Each task matches the general reasoning domain of some corresponding task in BIG-Bench Hard, ensuring that the diversity of BIG-Bench Hard is preserved while increasing task difficulty.
As seen in the middle column of the table, tasks in BIG-Bench Extra Hard are sourced from a variety of existing reasoning benchmarks and manually chosen according to their topic and difficulty. When curating the benchmark, authors aim to solve the following known issues with BIG-Bench Hard:
Many tasks have high random chance performance due to the presence of multiple choice questions with a small number of options (e.g., ~35% of tasks have binary output and ~20% of tasks use multiple choice with <5 options).
Some tasks permit shortcuts that allow the task to be “solved” without actually reasoning through a proper solution.
Task inputs tend to be very short—around 700 characters on average—across BIG-Bench Hard tasks, which is unrealistic compared to how LLMs are typically used in practice.
True multi-hop reasoning is rarely tested in BIG-Bench Hard due to limitations in LLM capabilities when the benchmark was created.
Ideally, we would like to solve all of these issues while expanding the set of reasoning capabilities being tested by the benchmark. BIG-Bench Extra Hard tasks contain 200 questions—except for DisambiguationQA, which has only 120. Although the task selection process was mostly manual, data was curated using a combination of manual human inspection with model assistance. Two models are used—a general purpose model and a reasoning model (both Gemini-based)—to iteratively evaluate data that is selected for each task. Tasks that were easily solved by the reference models were either i) discarded and replaced with more difficult tasks or ii) enhanced with harder reasoning examples. This process continued until both models achieved an accuracy below 70% on each task.
“In most cases, we tried to use the reference models only as a black box that provided feedback on the difficulty of our tasks. In some cases, however, making tasks more difficult required looking into the approach adopted by the model.” - from [7]
The combination of human and model oversight in BIG-Bench Extra Hard is interesting and provides motivation for unique ways in which humans can interact with LLMs to curate better evaluation data. For example, authors in [7] even mention manually inspecting reasoning traces from the models to help them think of more difficult examples that would actually challenge the model. Tasks in BIG-Bench Extra Hard have significantly expanded context compared to the prior benchmark, have negligible random chance performance, and provide a lot of headroom in performance even for top models (e.g., o3-mini); see below.
IFEval [8] and IFBench [9]
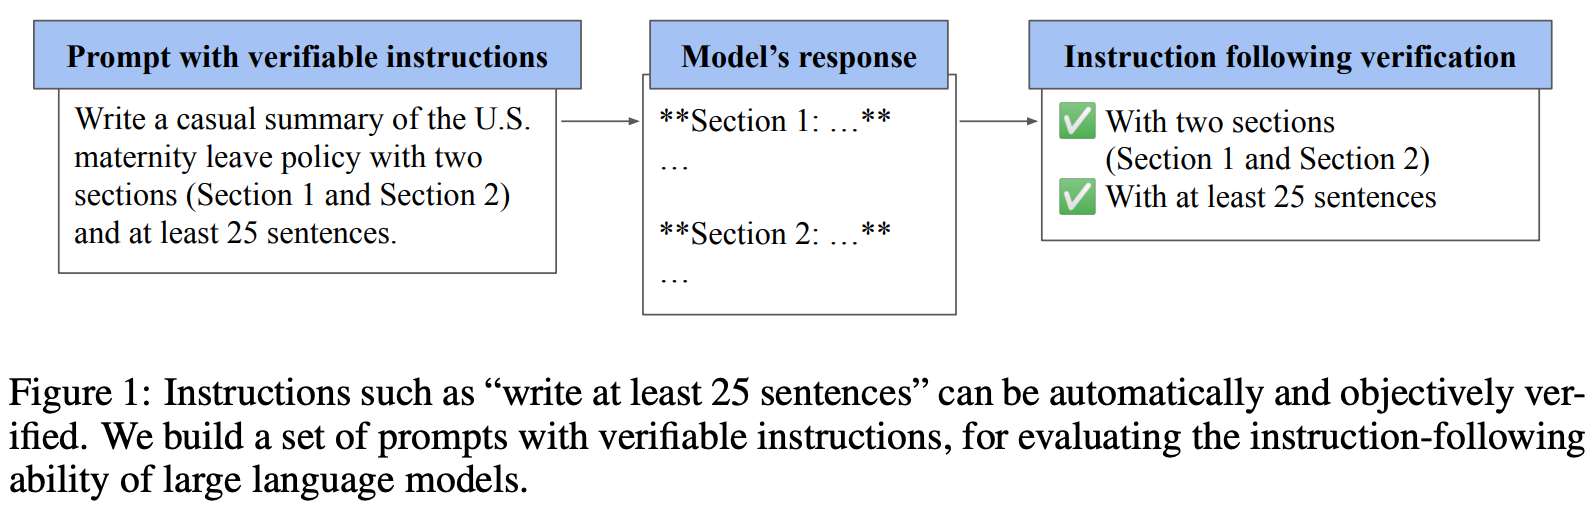
The IFEval [8] benchmark tests LLM instruction following capabilities, with an emphasis on instructions that are objectively verifiable (i.e., as opposed to instructions that are more subjective). For example, if we instruct an LLM to generate an output containing 100 to 200 words, we can easily verify whether this instruction was followed by using a basic script. However, verifying whether an LLM obeys a certain tone specification in its output is less straightforward.
“The task of precise instruction following evaluates a language model’s ability to perform a task t, such as summarization or creative writing, while adhering to one or more output constraints c, which can be automatically verified.” - from [9]
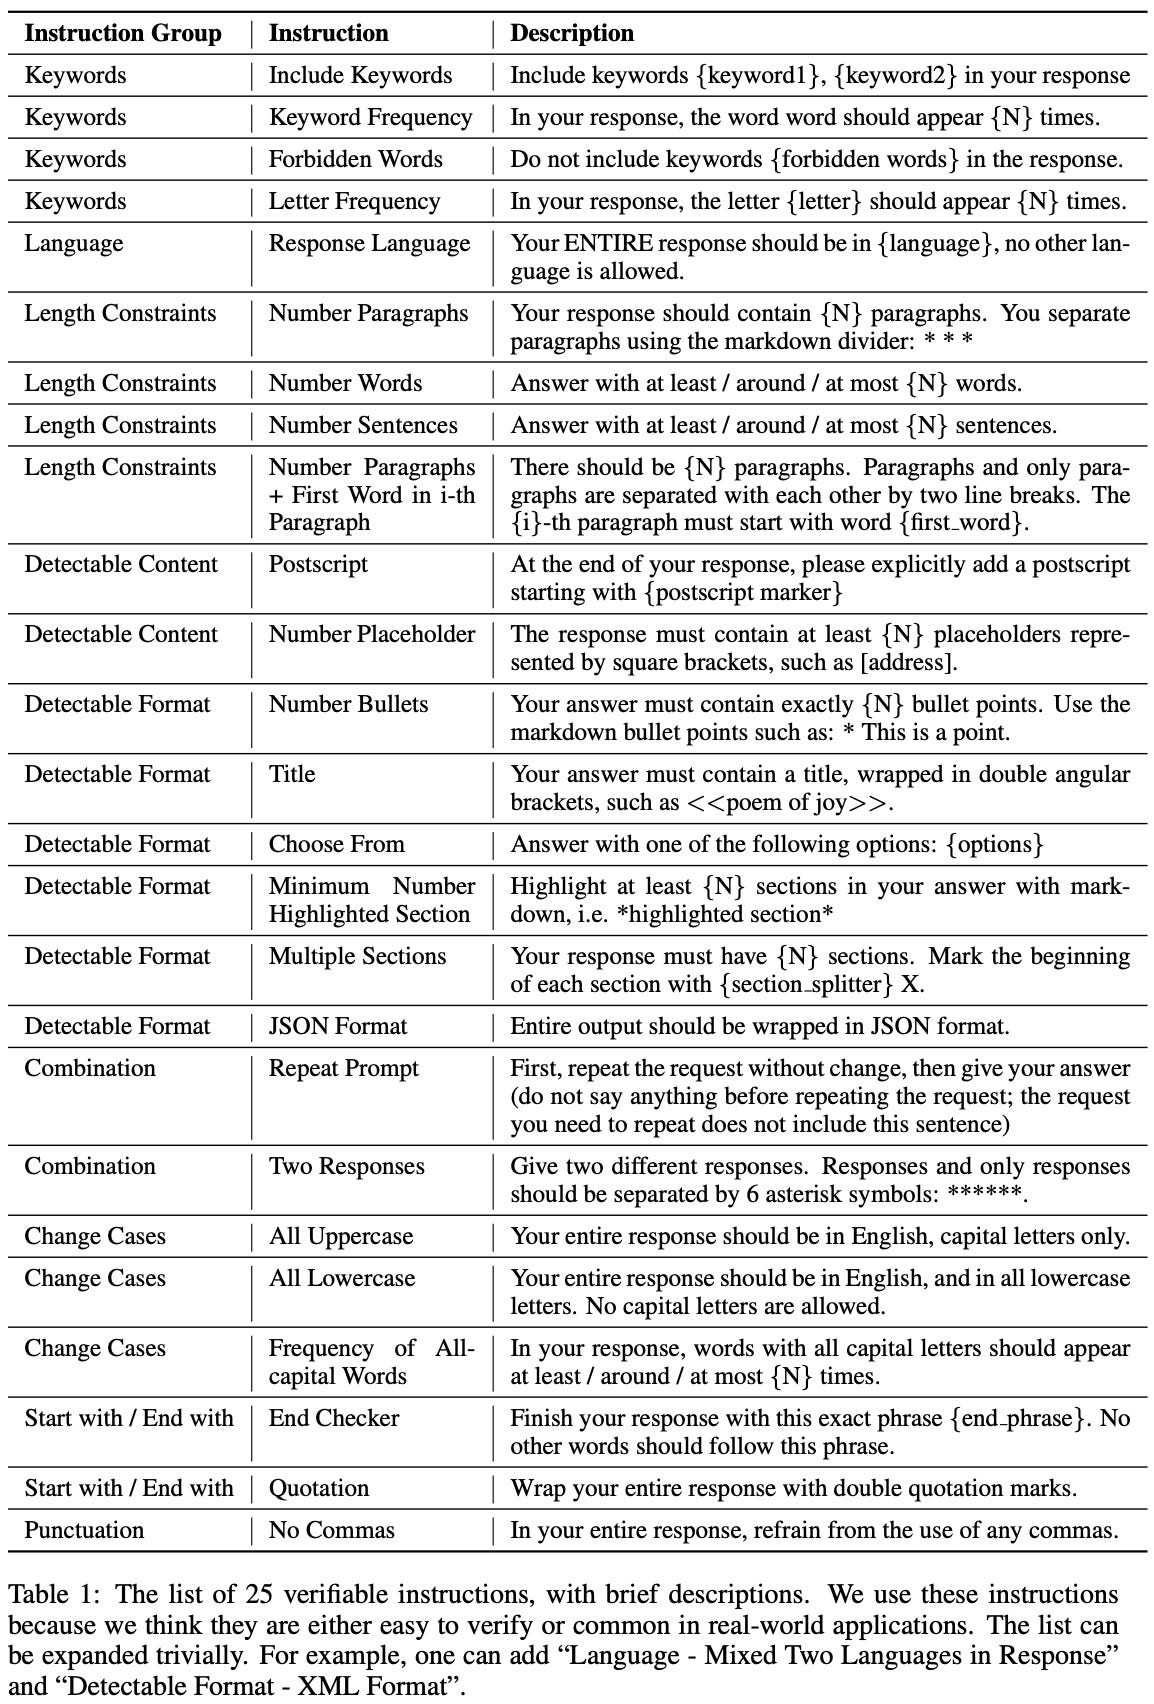
To start, 25 instructions—structured as verifiable constraint templates for the model’s output—are manually curated based on practicality and verifiability; see below.
From these instructions, evaluation samples are curated as follows:
Create a set of base prompts5.
Combine these base prompts with one to three randomly selected verifiable instructions by concatenating instructions to the end of the prompt.
Use few-shot prompting and manual inspection to identify instruction combinations that are illogical or contain conflicts.
Use few-shot prompting to rephrase each prompt and, in turn, improve the diversity of instructions in the benchmark.
Manually review all rephrased prompts.
Exact details of the data curation process are not fully outlined in [8]. However, we know from the information provided that a model-in-the-loop approach is used with manual human review to ensure quality. To measure performance, a binary verification check is created for each instruction that can be used to determine if a model followed an instruction or not. Instruction-level binary verification signals can be used to compute the following strict metrics:
Instruction-level strict accuracy: the percentage of all individual instructions that the model follows.
Prompt-level strict accuracy: the percentage of prompts for which the model follows all instructions.
Additionally, several loose metrics are considered in [8] that perform verification under a variety of transformations to the model output (e.g., removing markdown and removing the first or last lines). After applying a transformation, we can compute instruction and prompt-level accuracy similarly to before, resulting in a loose version of each metric. An instruction is considered solved if it passes verification after any of the possible transformations that are tested.
“The new constraints we introduce were created manually – sourced by collecting feedback from LM users beyond the authors on the types of constraints they have tried with models, or manually written to cover core instruction following skills. Then, we filtered constraints for the benchmark to those that can be easily paired with a verification function written in Python, making for reproducible evaluation and training tools.” - from [9]
The IFEval benchmark only tests 25 instructions and, therefore, risks overfitting to a small set of constraints. As a solution, IFBench [9] proposes an expanded set of 58 verifiable, manually-curated constraints. When deriving new constraints, authors i) inspect feedback from LLM users on instruction following issues, ii) focus on core areas of instruction following, iii) emphasize difficult constraints, and iv) only use constraints that can be verified with a Python function. Going further, an additional set of 29 constraints (IFTrain) are provided for training purposes. These training constraints can be used for RLVR training, enabling investigation into the generalization properties of instruction following.
The 58 constraints in IFBench are grouped into seven categories—count, ratio, words, sentence, format, custom, and copy—that cover a broad range of instruction following skills. To create prompts for these instructions, authors take unseen prompts from WildChat and combine them with either one or two constraints from the expanded set. Every test prompt is manually inspected by a human annotator to ensure constraint compatibility, and the final benchmark consists of 300 total prompts. As shown below, performance on IFBench is noticeably lower than on IFEval, indicating some level of overfitting to specific constraints.
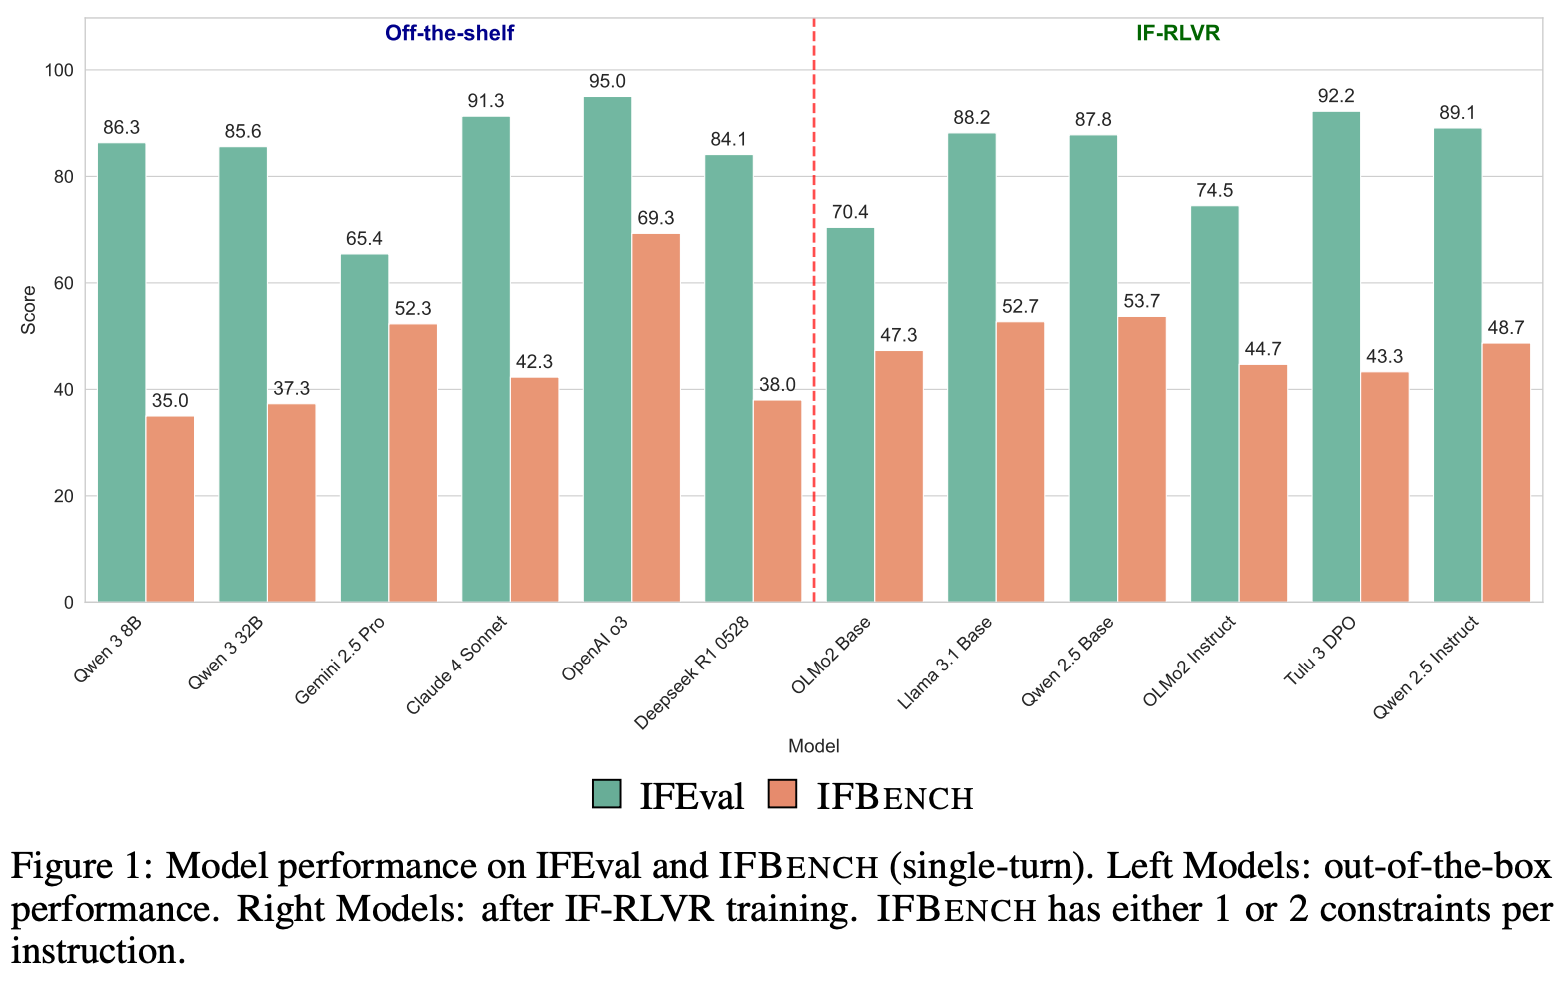
Authors in [9] provide a potential reason for the overfitting to IFEval constraints. Many LLMs have curated training data that specifically targets instruction following capabilities. Most of this training data is synthetically generated because precise instruction following can be deterministically verified. Given the popularity of IFEval, model developers often adopt the same constraint taxonomy when generating synthetic instruction following data; see Nemotron-4 340B as an example. As a result, some models may be explicitly trained to follow the same constraints being tested by IFEval, leading to inflated performance metrics6.
AlpacaEval [13]

AlpacaEval is a pairwise instruction following benchmark that measures model performance by using an LLM judge to compare candidate model completions to those of a baseline model; see above. The most recent version of AlpacaEval uses GPT-4-Turbo as both the baseline and judge model. The data used in AlpacaEval is sourced from the earlier AlpacaFarm dataset, which contains a total of 805 prompts derived by combining the evaluation sets from:
Despite the variety of data sources, most of this data is curated using a similar approach. For example, Self-Instruct proposes a synthetic data generation strategy for instruction tuning, but prompts from the evaluation dataset for Self-Instruct are manually written by human experts. Similarly, Anthropic helpfulness is a human preference dataset, while the Vicuna and Koala test sets are manually curated by researchers working on the projects. The only outlier of these evaluation sets is Open Assistant, which is derived from crowdsourced human conversations with an LLM, rather than being curated by experts.
“AlpacaEval is an LLM-based automatic evaluation that is fast, cheap, and reliable. It is based on the AlpacaFarm evaluation set, which tests the ability of models to follow general user instructions. Responses are compared to reference responses by the provided GPT-4 based auto-annotators [to compute a win rate]. AlpacaEval displays a high agreement rate with ground truth human annotations.” - AlpacaEval
After the initial release of AlpacaEval, several follow-up versions of the benchmark were published, but the underlying evaluation data did not change much. Instead, subsequent improvements to AlpacaEval focused on changing the reference and judge models to improve the benchmark’s correlation with human preferences. Full code and updates to AlpacaEval can be found here.
Math Evaluation
Many evaluation datasets exist in the math domain, and most of them are either i) expert-curated or ii) drawn from test banks for math competitions. For example, GSM-8K contains 8.5K human-written grade school math problems, while MATH contains 12.5K questions compiled from high school math tests. Additionally, the American Invitational Mathematics Examination (AIME), which is commonly used to evaluate LLMs, is released every year with a set of 15 new questions. Questions from the American Mathematics Competitions (AMC) are also commonly used for LLM evaluation. Solutions to questions in these benchmarks are usually graded with an automatic verifier or exact string matching.
The benchmarks outlined above have been saturated by modern LLMs, but many frontier-level math benchmarks have been recently proposed:
FrontierMath contains hundreds of expert-crafted problems at the cutting edge of mathematical research that require hours or days to be solved by an expert-level researcher.
RealMath is a continuously-evolving benchmark that automatically updates with new problems derived from research papers and discussion forums.
MathArena is an evolving benchmark that evaluates LLMs on math competition problems soon after their release to avoid contamination risk.
OmniMath contains 4.5K competition-level math problems that have been annotated by human experts, covering a diverse range of topics (i.e., over 30 sub-domains) and difficulty levels.
Solutions to questions in these benchmarks are still commonly evaluated with automatic verifiers, but this is not always the case. For example, proof-based questions in MathArena are manually checked by human experts. Despite the impressive math capabilities of modern LLMs, most of these frontier-level math benchmarks have not yet been fully saturated. However, LLMs are advancing rapidly in their capabilities, so several of these datasets are designed in a way that enables continual evolution in order to avoid contamination and saturation.
Iteratively Improving a Benchmark
When studying the benchmarks outlined above, we see several examples of iterative benchmark refinement. Benchmarks become saturated and less informative over time, which is usually addressed by releasing an improved benchmark. To create such an improved benchmark, there are several common techniques and directions that are usually followed, such as:
Difficulty-based refinement: curating more difficult tasks or data to use for evaluation within a benchmark.
Quality-based refinement: identifying and fixing issues in the benchmark (e.g., mislabeled data, vague or unrealistic questions, poor format, etc.).
Diversity-based refinement: expanding the scope of questions and topics covered by a particular benchmark.
Usually, these directions of improvement are handled via manual human review, a model-in-the-loop approach, or some combination of both. In some cases, we can even design a benchmark in a way that continually evolves over time without too much manual effort (e.g., RealMath and MathArena). However, the range of techniques that can be used for iterative benchmark improvement is vast—there is a lot to learn in this area. To provide pointers for future learning, a set of useful resources for benchmark improvement is listed below:
Do Large Language Model Benchmarks Test Reliability?: corrects labeling errors in common LLM benchmarks to better measure LLM reliability.
Improving Model Evaluation using SMART Filtering of Benchmark Datasets: a framework for systematically identifying and filtering evaluation data that is too easy, similar to other questions, or possibly contaminated.
From Crowdsourced Data to High-Quality Benchmarks: an LLM-based approach for post-processing crowdsourced data into high-quality evaluation samples.
Reliable and Efficient Amortized Model-based Evaluation: a model-based approach for difficulty filtering and difficult question generation.
Evidence-Centered Benchmark Design for NLP: an evidence-backed framework for properly designing evaluation benchmarks.
Evaluation Guidebook (from Hugging Face): a practical field guide for evaluating LLMs, assessing benchmark quality, and curating evaluation data.
There are also many papers that have been proposed for optimally selecting subsets of benchmark data to improve efficiency [14, 15, 16, 17].
Advanced Benchmarking for LLMs
Now that we understand practical details for constructing LLM benchmarks, we will take a deeper look at some advanced techniques for LLM evaluation that have been proposed in recent research. Specifically, we will focus on a set of papers that use Item Response Theory (IRT) to select the most informative data for evaluation. Coming from the field of psychometrics, IRT uses statistical modeling to dynamically measure how an individual’s latent abilities interact with the properties of an item (or question) to determine the probability of a correct response. Although IRT is commonly applied in standardized testing environments, the same concepts have been adopted by LLM researchers. We can directly apply techniques from IRT to LLM evaluations by considering the LLM as our individual and the evaluation dataset as our standardized test!
In the context of LLM evaluations, IRT considers a model l, dataset items i, and the probability p_il that model l gets item i correct. We can use a variety of different models—usually just different variants of logistic regression—to predict this probability. IRT models include parameters for both the model and the item being evaluated. Whereas model parameters capture the capabilities of a given model, item parameters capture the following properties:
Difficulty: whether the item is easy or difficult to answer correctly.
Discrimination: whether answer correctness has a strong relationship with the capability level of a model.
By capturing these properties within our IRT model, we gain a rich description of our evaluation data that can be directly applied to benchmark improvement. For example, items with low discrimination are often problematic (e.g., due to mislabeling), and we can consider filtering out items that are too easy from the evaluation process. Within this section, we will see several IRT formulations that demonstrate a broad set of potential applications to the evaluation process.
tinyBenchmarks: Evaluating LLMs with Fewer Examples [11]
“Evaluating the performance of a single LLM on HELM costs over 4K GPU hours (or over $10K for APIs). Benchmarks like AlpacaEval also require a commercial LLM as a judge to perform evaluation, further increasing the costs… evaluation of a single model is often performed many times to… explore different prompting strategies or a wider range of hyperparameters.” - from [11]
To mitigate excessive inference costs during evaluation, an IRT-based approach called tinyBenchmarks is proposed in [11] that intelligently samples evaluation data in a way that maintains the accuracy of a model’s performance metrics. We assume access to a dataset of historical evaluation results that can be used for selection and performance estimation. More specifically, this dataset contains items i and models l, where each item and model combination has a binary score Y_il ∈ {0, 1}. We can also handle continuous evaluation results in the range [0, 1]—nearly any evaluation setting can be converted into this format by normalizing scores—by simply binarizing scores according to a fixed threshold.
Baselines. There are a few simple and effective approaches that can be adopted to sample a subset of data from an evaluation dataset:
Stratified random sampling: ensure proportional representation across benchmark sub-domains by randomly sampling a subset of evaluation samples separately within each subdomain.
Correctness-based clustering: sample evaluation data based on patterns in correctness by representing each item
ias a vector of correctness scores for each modell, performing K-means clustering on these vectors, and selecting the evaluation samples closest to each cluster centroid.
Despite their simplicity, these techniques have notable drawbacks. Stratified sampling leads to high variance and uncertainty when the number of samples is small, while correctness-based clustering tends to suffer from the curse of dimensionality if we have evaluation results from a large model pool.
IRT model. In [11], IRT is used to derive a much smaller representation of our evaluation data that can be more effectively used to both select samples and estimate performance. We define item i using two parameters:
α_i: captures the skills required to solve itemi.β_i: captures the overall difficulty of itemi.
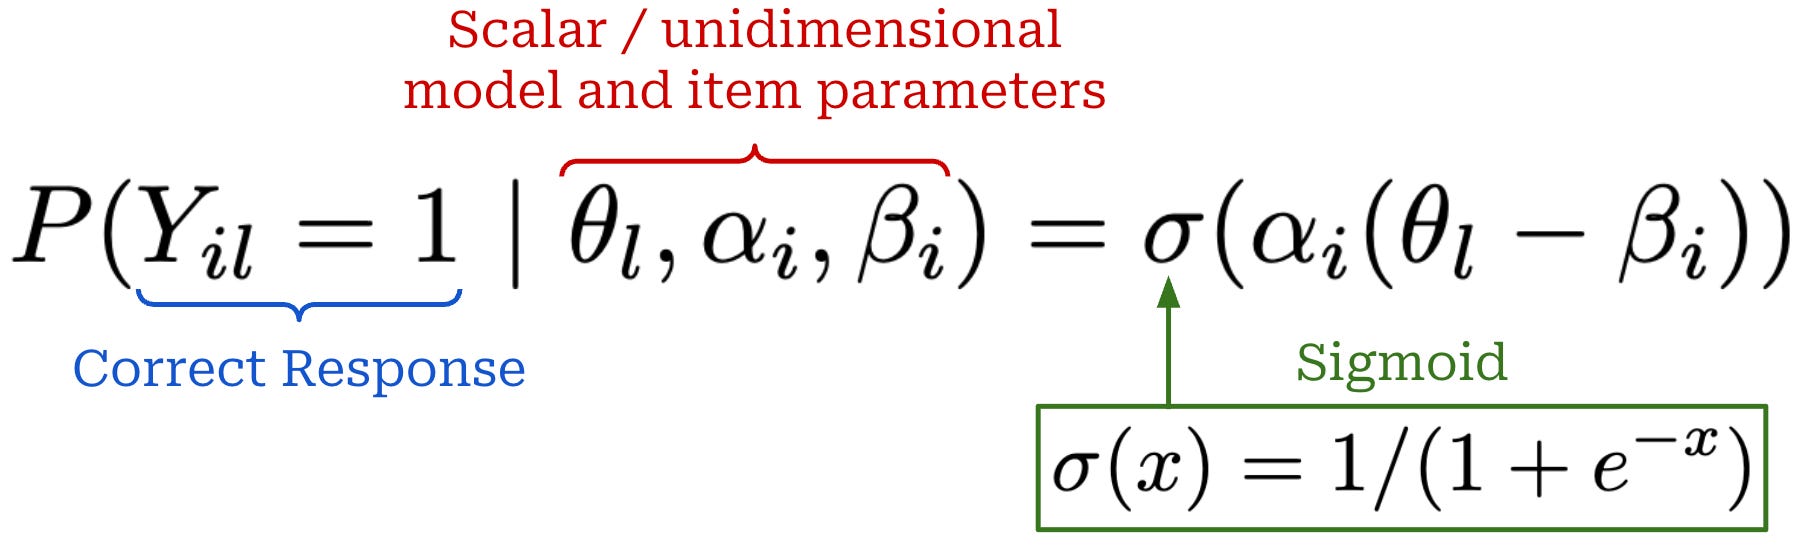
Similarly, we describe model l with the parameter θ_l, which captures model capabilities. From here, we define a multidimensional IRT model, which predicts the probability p_il that item i will be answered correctly by model l; see below. We can fit the IRT model—or learn the correct values for all of the model and item parameters—by using our historical evaluation dataset as training data.
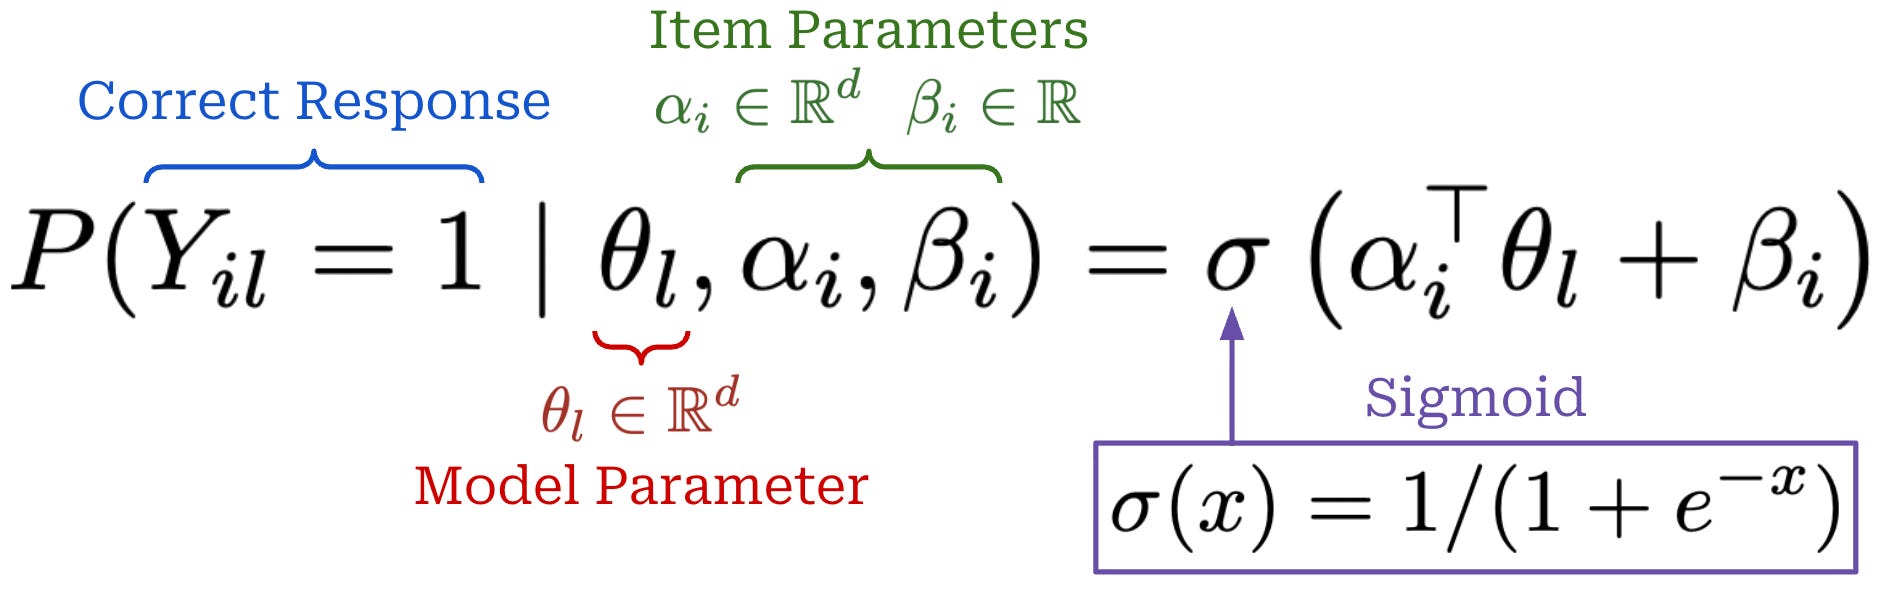
As we can see, the center point of this equation is the inner product of the item and model parameter, which captures how well the capabilities of a model match those needed for an item. Intuitively, a model is more likely to answer an item correctly if it has strong capabilities in the same directions required to solve an item and vice versa. Additionally, we add an extra bias term to this inner product to account for overall item difficulty before passing the full expression through a sigmoid (or logistic) function to yield a probability in the range [0, 1].
“The IRT model creates a meaningful representation for each example i based on their difficulty and the abilities required to respond to those examples correctly. This approach immediately solves the dimensionality problem, since E_i is low-dimensional… IRT should represent which examples have similar difficulty and require similar abilities.” - from [11]
Once fitted, parameters of the IRT model naturally provide a d + 1 dimensional vector E_i = (α_i, β_i) that can be used to represent items in our evaluation dataset. This representation is low dimension (d < 16 in [11]) compared to vectors used for correctness-based clustering, thus solving issues related to the curse of dimensionality. The IRT model is used in two ways in [11]:
To perform cluster-based sampling, similarly to correctness-based clustering (but with embeddings from the IRT model
E_i).To predict model performance over items—this is more efficient than actually running the evaluation itself.
p-IRT estimator. In [11], the two approaches described above are used in tandem to efficiently estimate model performance on an evaluation set. Assume we want to evaluate a new model l’ on an existing evaluation set for which we already have an IRT model fitted. We can use clustering to identify “anchor points”—or high-signal evaluation samples—in the data and evaluate our model only on these samples. The number of anchor points is a hyperparameter that can change with our evaluation budget. We can then keep our existing item parameters fixed in the IRT model and only train the parameter for our new model θ_l’, using real evaluation results on our anchor points as training data. After obtaining θ_l’, we can predict performance on the remaining items by using our IRT model.
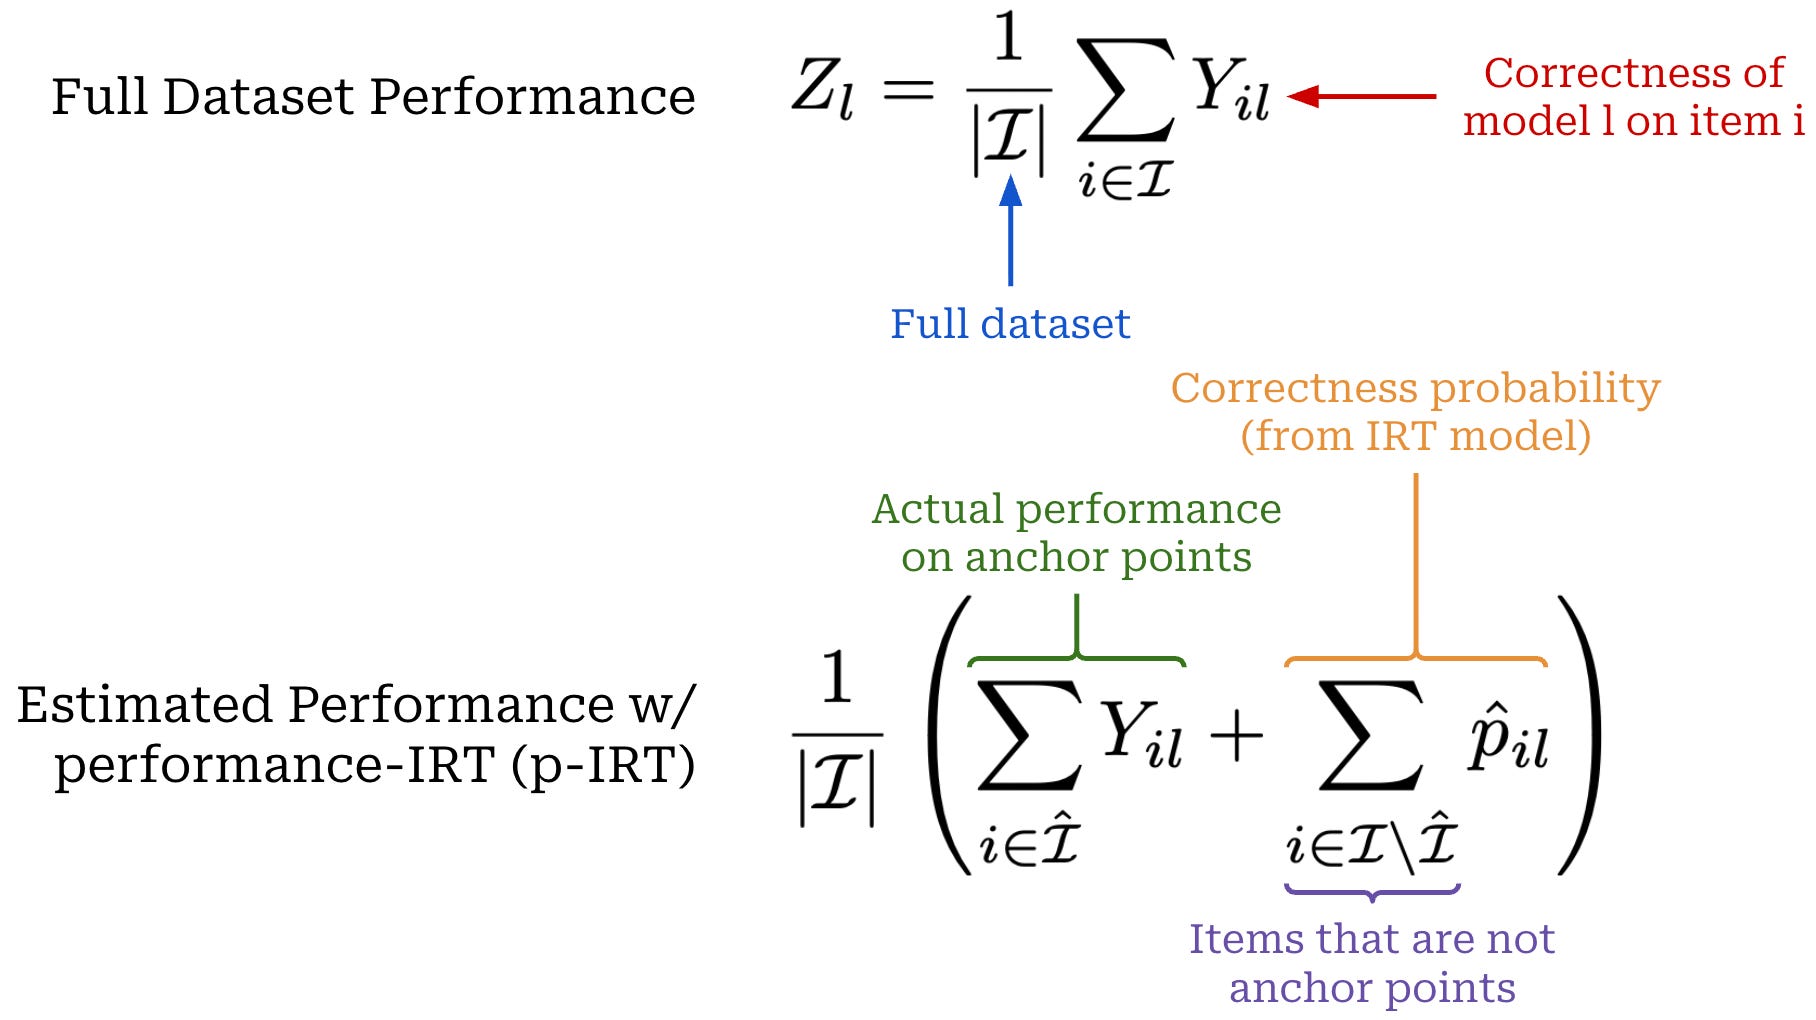
A formal description of this approach, called the p-IRT estimator in [11], is outlined above. Put simply, we are interested in measuring the model’s actual performance on the full evaluation set, but running an entire benchmark is expensive. Instead, we use IRT model parameters to obtain K anchor points via clustering—where K is much smaller than the full dataset size—and only evaluate our model on these anchor points. Then, we can estimate performance on the rest of the evaluation dataset using the IRT model and derive an overall performance estimate by averaging real and predicted evaluation results; see above.
Beyond the p-IRT estimator, we can estimate performance with a sample average of the model’s performance on the anchor points only. This sample average has low bias because we are using correctness values obtained from our model on the actual evaluation data. However, the variance of the sample average is high when the number of anchor points K is small. On the other hand, the p-IRT estimator is biased—due to the fact that our IRT model is not perfectly accurate—but has low variance. Therefore, we can create an estimator that combines the strengths of both approaches by taking a convex combination of each estimate; see below.
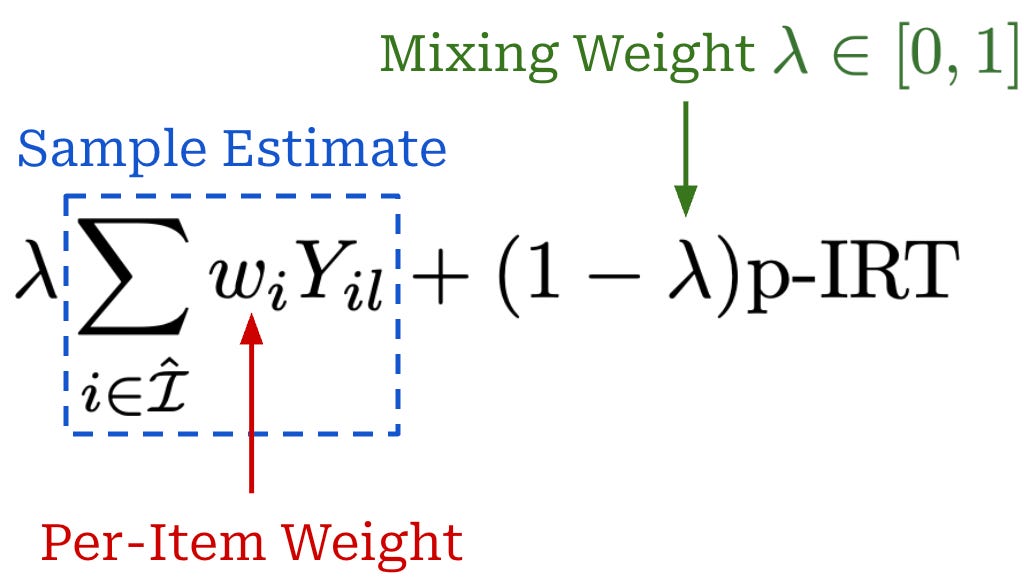
This revised estimator is referred to as IRT++ in [11]. The per-item weight in this expression is optional but can be used to assign non-uniform weights to anchor points. For example, this weight can correspond to the ratio of evaluation samples present in the cluster used to derive a given anchor point. In [11], λ lies in the range [0, 1], and the optimal value of λ depends upon several factors (e.g., the number of anchor points and the variance of our performance estimate). The value of λ is derived in [11] by using a heuristic proposed in prior work.
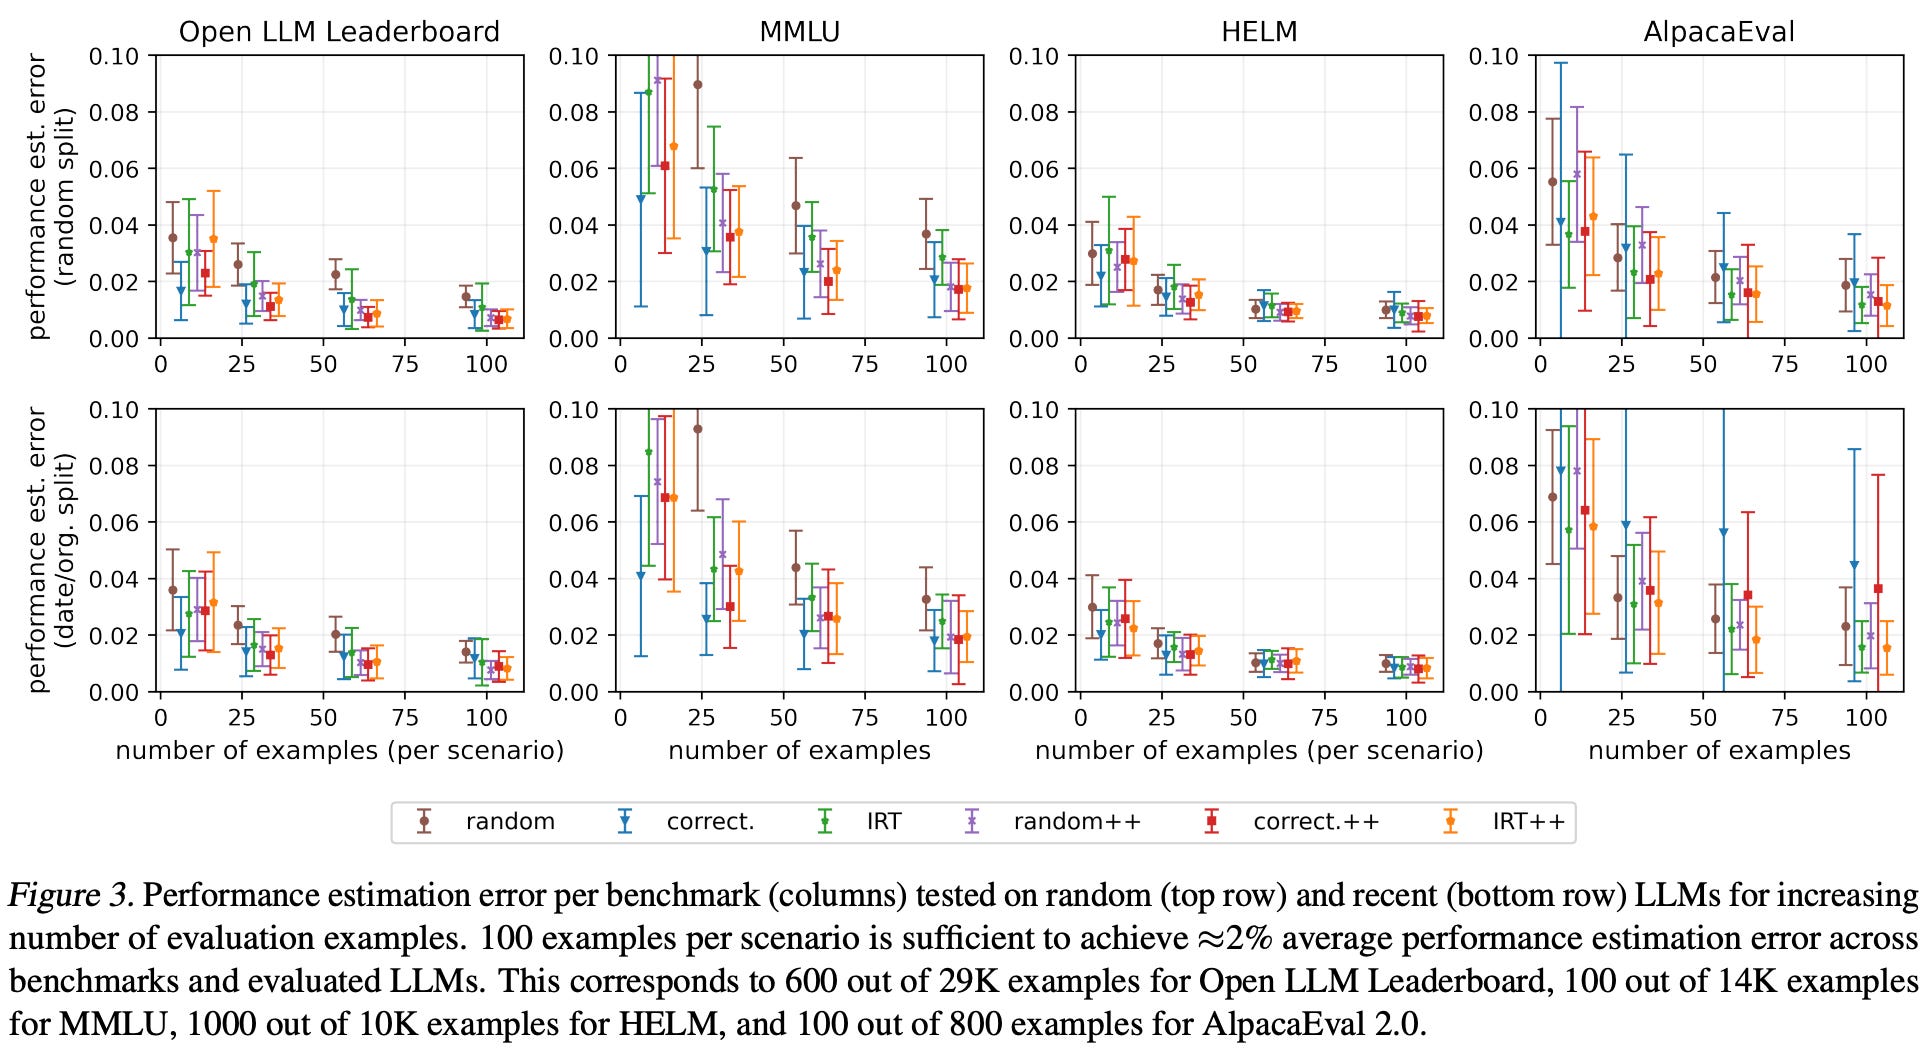
Efficient evaluation. To test the efficacy of IRT-based performance estimation, four benchmarks are considered—Open LLM Leaderboard, MMLU [1], HELM, AlpacaEval 2.0 [13]—and we compare the estimated and actual performance on each benchmark. Training data for the IRT model is collected from a large number of LLMs—395 models for Open LLM leaderboard and MMLU, 30 models for HELM, and 100 models for AlpacaEval 2.0—to ensure the quality of the IRT model. The LLMs are split into training and test sets using two approaches:
Random: randomly sample a subset of LLMs to use for testing.
Date-based: use the most recent LLMs for testing.
As shown below, the proposed IRT-based estimators perform well across all scenarios considered. With as few as 100 anchor points per sub-domain of the evaluation set—a reduction of 140× for MMLU and 160× for the Open LLM Leaderboard—we can estimate performance with less than 2% error.
Fluid Language Model Benchmarking [12]
Most LLMs are evaluated in a static fashion (i.e., by computing accuracy on a fixed dataset). Whereas raw accuracy treats every evaluation sample equally, IRT estimates a model’s underlying capabilities, taking into account factors like the difficulty and discrimination of each question. Leveraging this insight, authors in [12] propose an approach called Fluid Benchmarking that uses an IRT model to dynamically select evaluation data for a particular model. The key idea behind this approach is that the value of an evaluation sample depends upon a model’s capabilities. Instead of assuming there is a single best subset of examples on which to evaluate an LLM, Fluid Benchmarking dynamically selects the most informative evaluation examples for a particular model and, in turn, provides a more accurate estimate of that model’s performance.
“Fluid benchmarking is based on the insight that the relative value of benchmark items depends on an LM’s capability level… a hard question might be too difficult for a weak LM, but informative for a strong LM.” - from [12]
Unidimensional IRT. Similarly to before, the approach in [12] fits an IRT model using a dataset of historical evaluation data derived from evaluating a large set of models on a benchmark of interest. However, a different IRT model structure is used in [12]. As shown below, this is again a two-parameter IRT model that is used to predict binary evaluation outcomes, but we use unidimensional—as opposed to the multidimensional approach used in [11]—model and item parameters. Authors mention testing a multidimensional IRT approach in [12] but found that this formulation performs poorly compared to a unidimensional IRT model.
Despite the different IRT model structure used in [12], the purpose of these parameters remains the same:
θ_l: a scalar parameter that represents the capability of modell.α_i: a scalar parameter that captures the discrimination7 of itemi.β_i: a scalar bias that represents the difficulty of itemi.
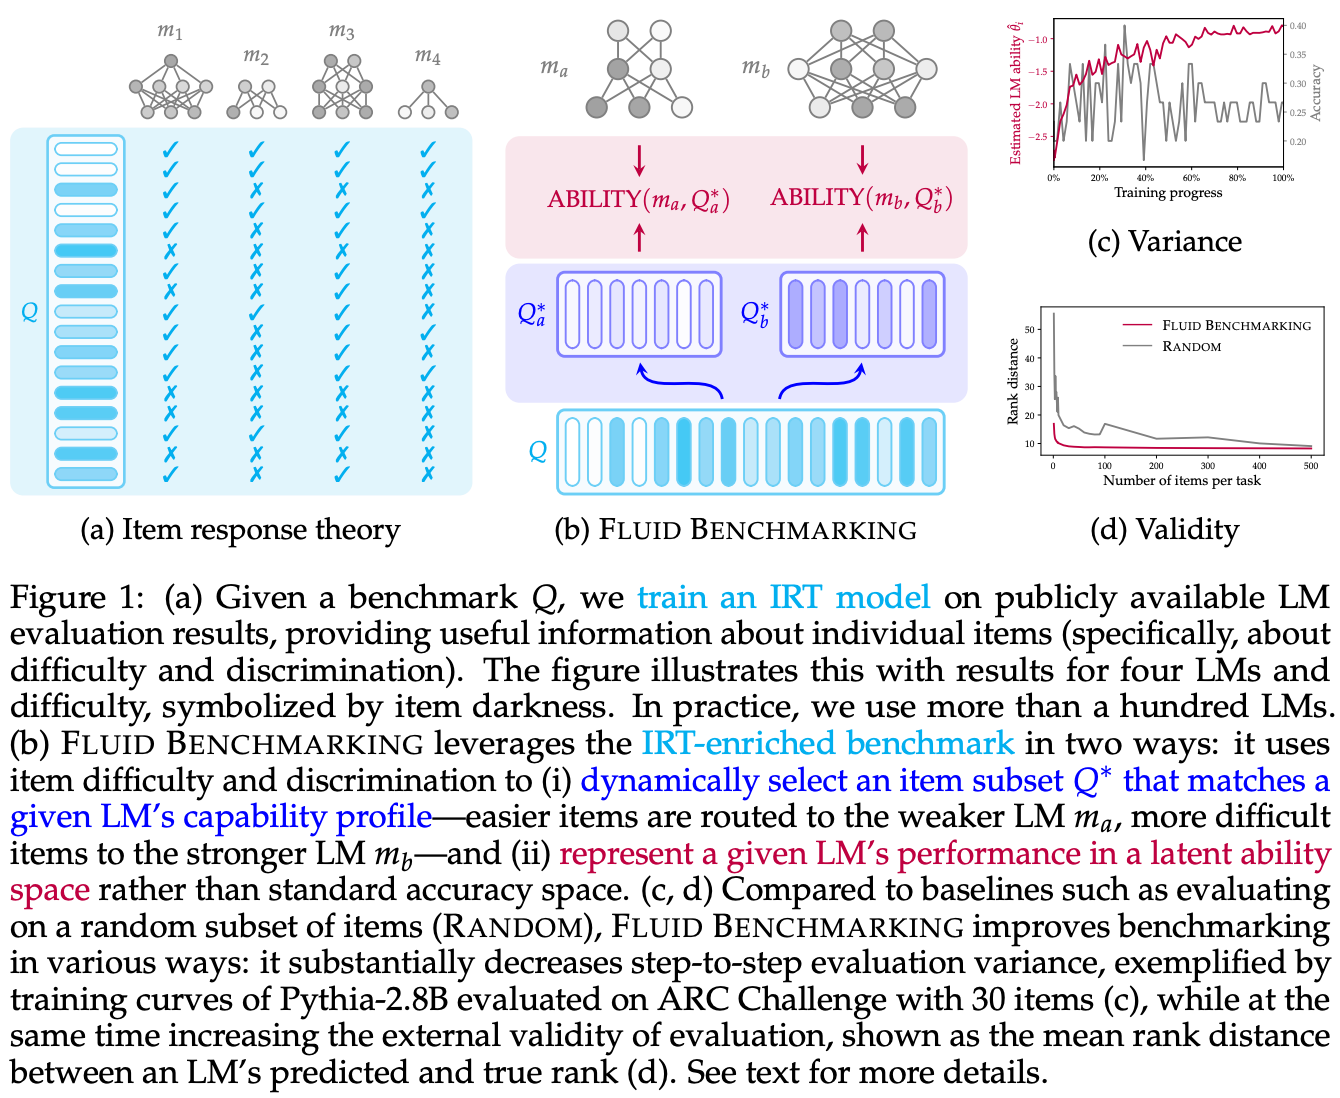
The Fluid Benchmarking approach proposed in [12] is depicted above. There are two main phases for obtaining a benchmark result:
An offline (or historical) phase, where we fit item and model parameters in the IRT model from leaderboard-style results on our benchmark.
An online phase, where we learn the parameter of a new model given a subset of evaluation results for this model on our benchmark.
The IRT model is initially fit using an offline dataset of evaluation results. Given a new model l’, we first evaluate this model on a subset of our evaluation set to obtain some training data for the new model parameter θ_l’. Similarly to [11], we then leave item parameters fixed and fit only the new model parameter θ_l’ by using the actual evaluation data collected with our new model for training.
By examining the structure of our IRT model, we can intuitively understand how item parameter values can influence the value of θ_l’. Easy questions have a small (or negative) difficulty parameter β_i, so answering them correctly has minimal impact on θ_l’. On the other hand, correct answers to a difficult question will meaningfully impact the value of θ_l’. The same arguments hold in reverse for incorrectly-answered questions: answering a difficult question incorrectly is not a big deal, but easy questions will impact θ_l’ when answered incorrectly. The value of the discrimination parameter α_i impacts the magnitude of updates to θ_l’. Highly-discriminative items have large values of α_i, leading them to meaningfully impact the value of θ_l’ and vice versa.
Estimating performance. Instead of measuring performance with accuracy metrics, Fluid Benchmarking directly uses the value of θ_l’ as the performance metric for a model. While accuracy simply captures the ratio of items answered correctly in a benchmark, Fluid Benchmarking asks an inverse question: What capability level of our model is most likely to produce the pattern of incorrect and correct answers we observed? By answering this question, we can estimate performance in a way that meaningfully considers the difficulty and discrimination of each item in our evaluation set. Raw accuracy on a discrete evaluation dataset is a common proxy for measuring model capabilities. However, Fluid Benchmarking [12] forgoes this proxy, instead using IRT to directly estimate model capabilities.
“IRT draws upon existing LM evaluation results to enrich benchmarks with information about item difficulty and discrimination, which is leveraged to dynamically select items that match an LLM’s capability level… This contrasts with… static benchmarking, which assumes a globally optimal set of evaluation items for all LMs.” - from [12]
Dynamic sampling. The final detail necessary to understand Fluid Benchmarking is the data selection process. As mentioned previously, we use a subset of real evaluation results to estimate the parameter for a new model θ_l’. These items that are evaluated could be taken from a static evaluation set—this is a common approach in practice. However, Fluid Benchmarking argues that the set of items used for evaluation should be dynamically selected based on the model. For a weaker model, easier items will be more informative and vice versa.
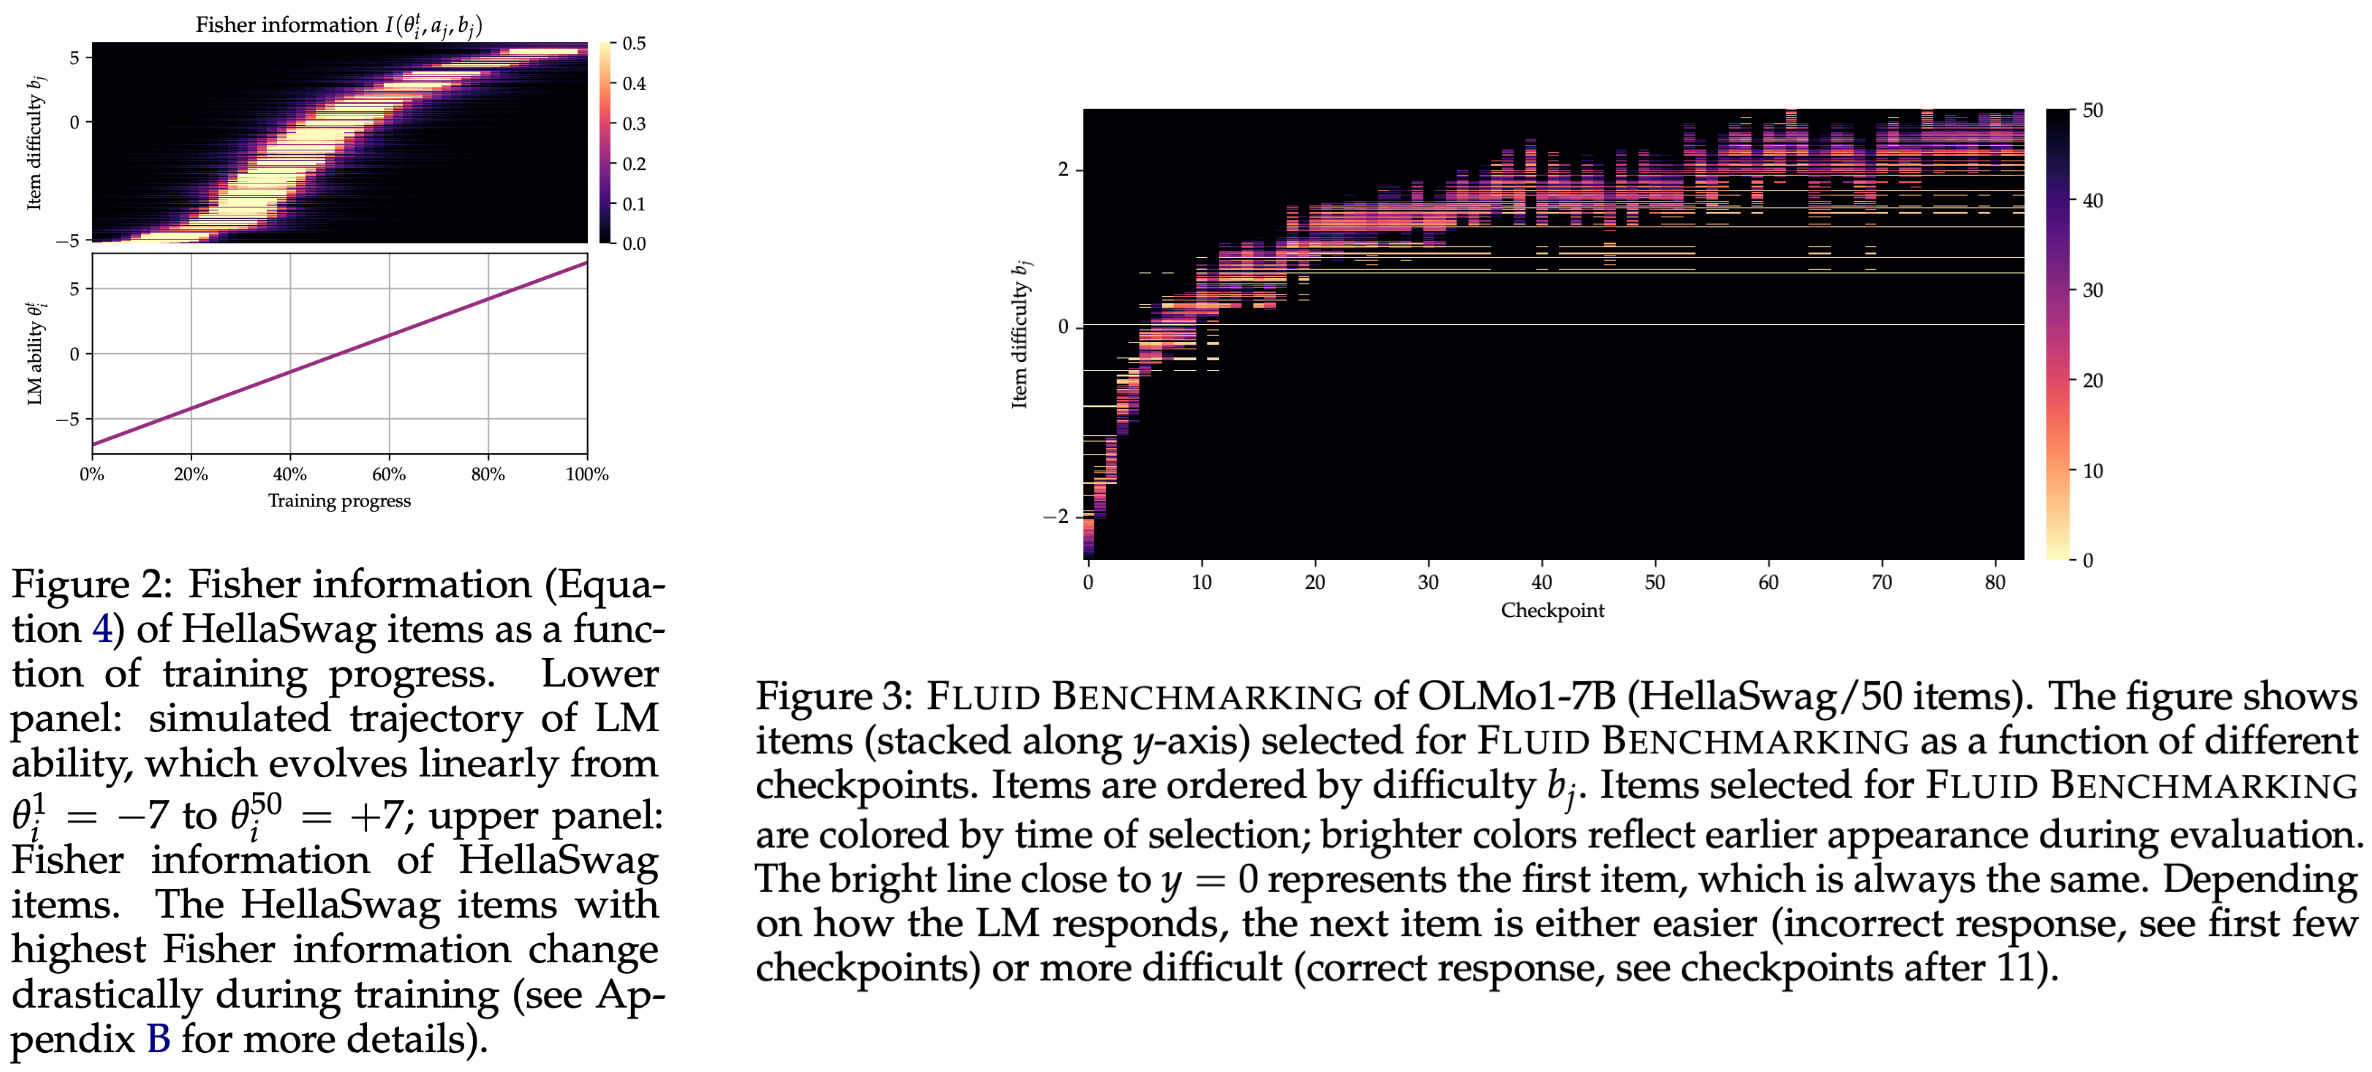
Evaluation items are selected in [12] by computing the Fisher information of each item in the dataset. This metric prioritizes items that are most informative for a particular model by considering i) item discrimination and ii) item difficulty with respect to the capability level of the model being evaluated. Notably, the Fisher information changes depending on the capability level of a model. The figure above illustrates changes in the Fisher information during the training process. As the model continues training, it becomes more capable, leading to changes in the Fisher information that prioritize the selection of more difficult examples.
To select evaluation data based on the Fisher information, authors in [12] propose the following set of steps:
Start with an empty evaluation set.
Compute the Fisher information of all items.
Select the item with the highest Fisher information.
Compute the true evaluation score of this item.
Re-fit the model parameter using this new data.
Repeat the above steps until your evaluation budget is reached.
While most LLM evaluations are static, Fluid Benchmarking is dynamic—the data used for evaluation is adapted based on each model being evaluated. Such an approach demonstrates the incredible potential of IRT for both selecting data and measuring performance, as well as its overall versatility as a tool. Notably, a very similar data selection approach is adopted by the more recent ATLAS paper.
Does this work? In [12], authors focus on evaluating model checkpoints during the pretraining process. Six different open LLMs in the 7B parameter range are selected, and checkpoints are taken from these models evenly throughout their training process to arrive at a set of 102 LLMs for fitting the IRT model. All evaluation experiments are performed on the Open LLM leaderboard, which is a composite leaderboard comprised of six different benchmarks. A separate IRT model is fit for each benchmark in the leaderboard. As shown below, Fluid Benchmarking provides a stable and accurate estimate of model capabilities and is found to be effective for a wide range of different evaluation budgets.
DatBench: Discriminative, Faithful, and Efficient VLM Evaluations [10]
“We identify critical failure modes that violate faithfulness and discriminability, misrepresenting model capabilities: (i) multiple-choice formats reward guessing, do not represent downstream use-cases, and saturate early as models improve; (ii) blindly-solvable questions which can be answered without images, constitute up to 70% of some evaluations; and (iii) mislabeled or ambiguous samples compromise up to 42% of examples in certain datasets.” - from [10]
Most popular Vision-Language Model (VLM) benchmarks have limitations that make research and progress difficult. Problems with these benchmarks include:
Data quality issues (e.g., incorrect labels or low-resolution images) that make solving certain questions overly difficult or impossible.
Blindly-solvable questions that can be solved purely based upon text priors without using the actual image.
Multiple choice questions that are easily reward hacked via guessing and do not much the generative style in which most VLMs are deployed.
Beyond these issues, the evaluation process alone is beginning to consume non-negligible compute for most models. LLM research is empirical, and as much as 20% (or even more) of total model development costs can be spent running evaluations. Based on this trend, we want to avoid wasted compute and ensure that the data in these benchmarks is actually useful for discerning model capabilities. Authors in [10] aim to solve these issues by developing and applying a targeted data curation approach over a wide set of VLM benchmarks to create DatBench, a composite benchmark that prioritizes high signal evaluation examples for VLMs.
Source data. The curation process in [10] begins with a large set of 33 evaluation datasets for VLMs that span the capability groups depicted above. A set of 27 state-of-the-art models ranging from 1-10B parameters is evaluated over these datasets, yielding a dataset of model evaluation results to use for data curation. From here, DatBench is constructed via a multi-step filtering process:
Converting multi-choice questions into a generative format.
Removing blind-solvable questions.
Filtering examples with incorrect or ambiguous ground truth.
(Optional) Identifying examples that yield maximum discrimination.
The last step of the pipeline is optional but can be used to sample a smaller amount of data that retains the ability to detect differences in model capabilities. Two different evaluation suites are created in [10]—DatBench and DatBench-Full—that cover distinct evaluation modes:
High-efficiency evaluation over a subset of data for rapid iteration.
High-quality evaluation over all data for cases with relaxed computational constraints and a need for better coverage.
For example, DatBench is most useful for ablation experiments, as we can lower inference costs and run faster experiments while still providing a useful capability signal. On the other hand, DatBench-Full can be used for final model reporting, which is run less often but requires comprehensively capturing the performance of a model. We will now outline each of the above curation steps in more detail.
Multiple choice to generative conversion. Practically, most VLMs are used in a generative fashion, where users ask questions to a model and the model generates a response for the user. However, many benchmarks used to evaluate VLMs ask question in a multiple choice format. Such a format can artificially inflate VLM performance due to the random guessing and the fact that selecting an answer is generally easier than generating that same answer from scratch.
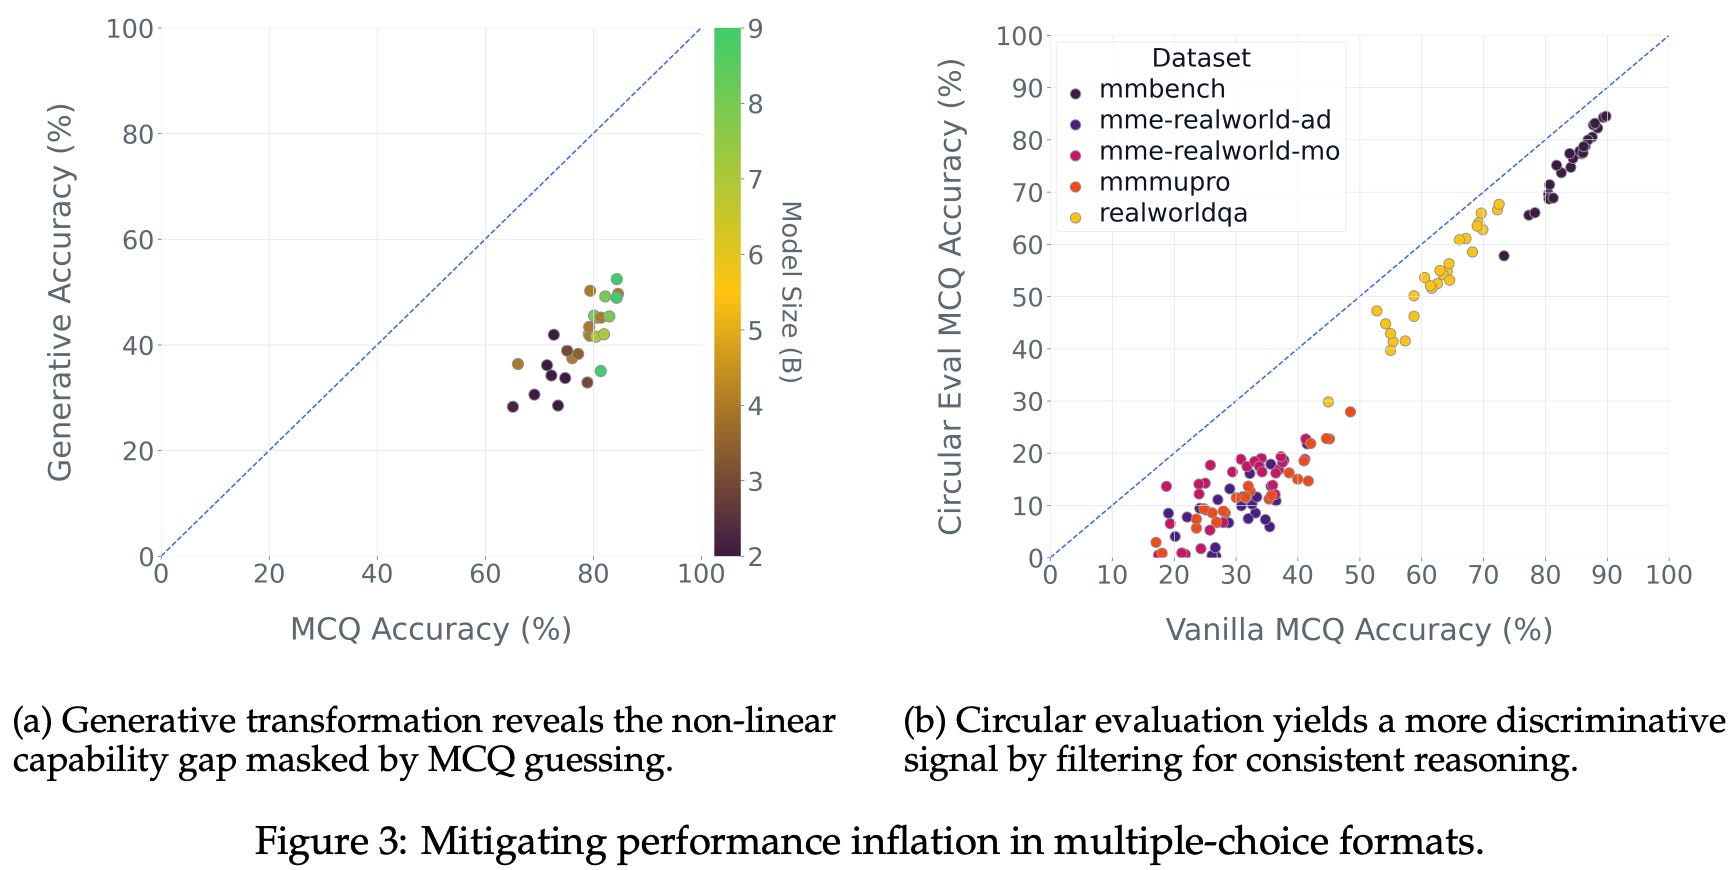
DatBench reformulates multiple choice questions into a generative format where the VLM generates an answer that is verified against a ground truth answer using an LLM judge. In cases where multiple choice is structurally necessary, authors in [10] rely upon a circular evaluation approach. As shown in the figure above, converting multiple choice questions into a generative format leads to a noticeable drop in model performance, indicating that generative evaluation is harder for current VLMs and better reflects the current state of model capabilities.
Removing blind-solvable questions. One key insight from [10] is the fact that a surprising number of VLM evaluation samples can be solved without using any visual data; see below. Models can rely upon language priors to solve questions (or provide a high-probability guess), thus inflating the performance of VLMs with strong language backbones. To identify these cases, we can re-run evaluation while removing image inputs to identify those that are blind-solvable. In [10], the entire suite of 27 models is run in a blind fashion, and any questions that can be solved by at least one model are removed. Though this filtering approach is aggressive, the likelihood of a correct blind answer in a generative setup is relatively low, and the curation process begins with a large source dataset.
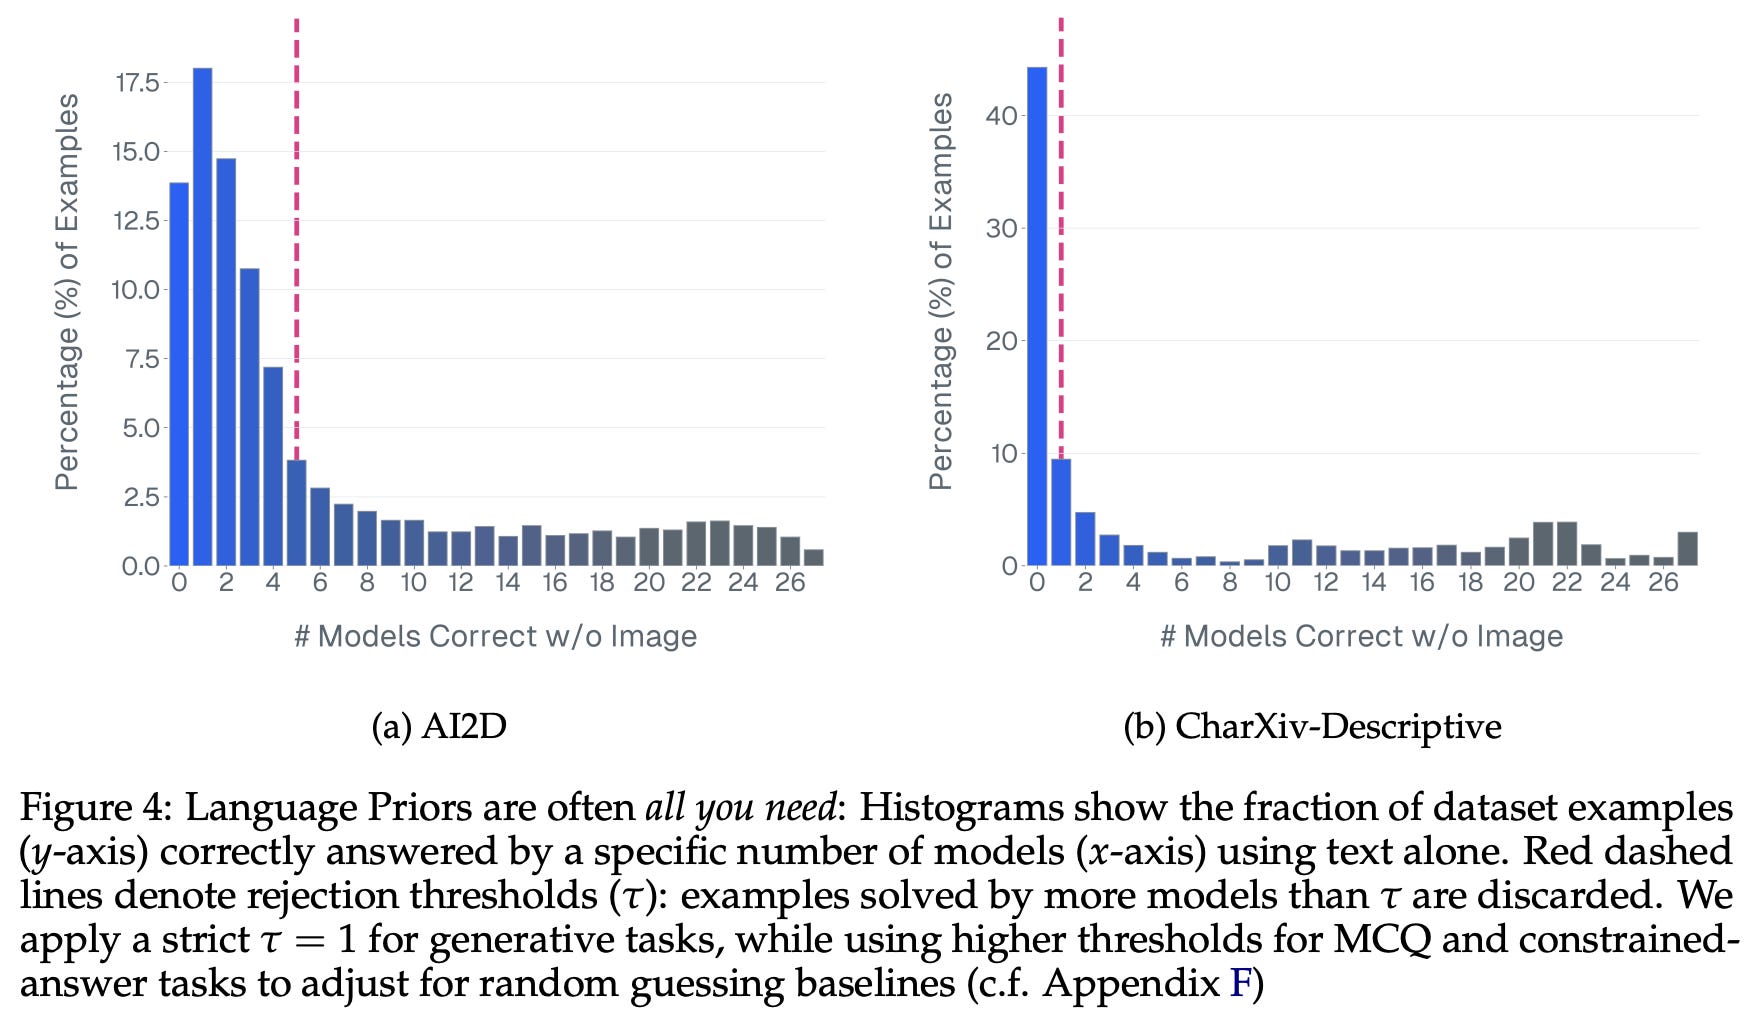
“In the first stage, we flag examples that all evaluated models answer incorrectly. Unanimous failure across a diverse suite of models typically indicates either a data quality issue or a genuinely difficult frontier case, both of which warrant closer inspection. In the second stage, a strong VLM judge (GPT-5.2) verifies each flagged sample with access to the ground-truth answer as privileged information.” - from [10]
Quality filtering. A two-stage pipeline is used in [10] to identify incorrect, low quality, and ambiguous evaluation data; see below. In the first stage, we flag any evaluation examples that are not solved by any model in the suite. These samples are usually either i) a data quality issue or ii) a valid frontier evaluation case.
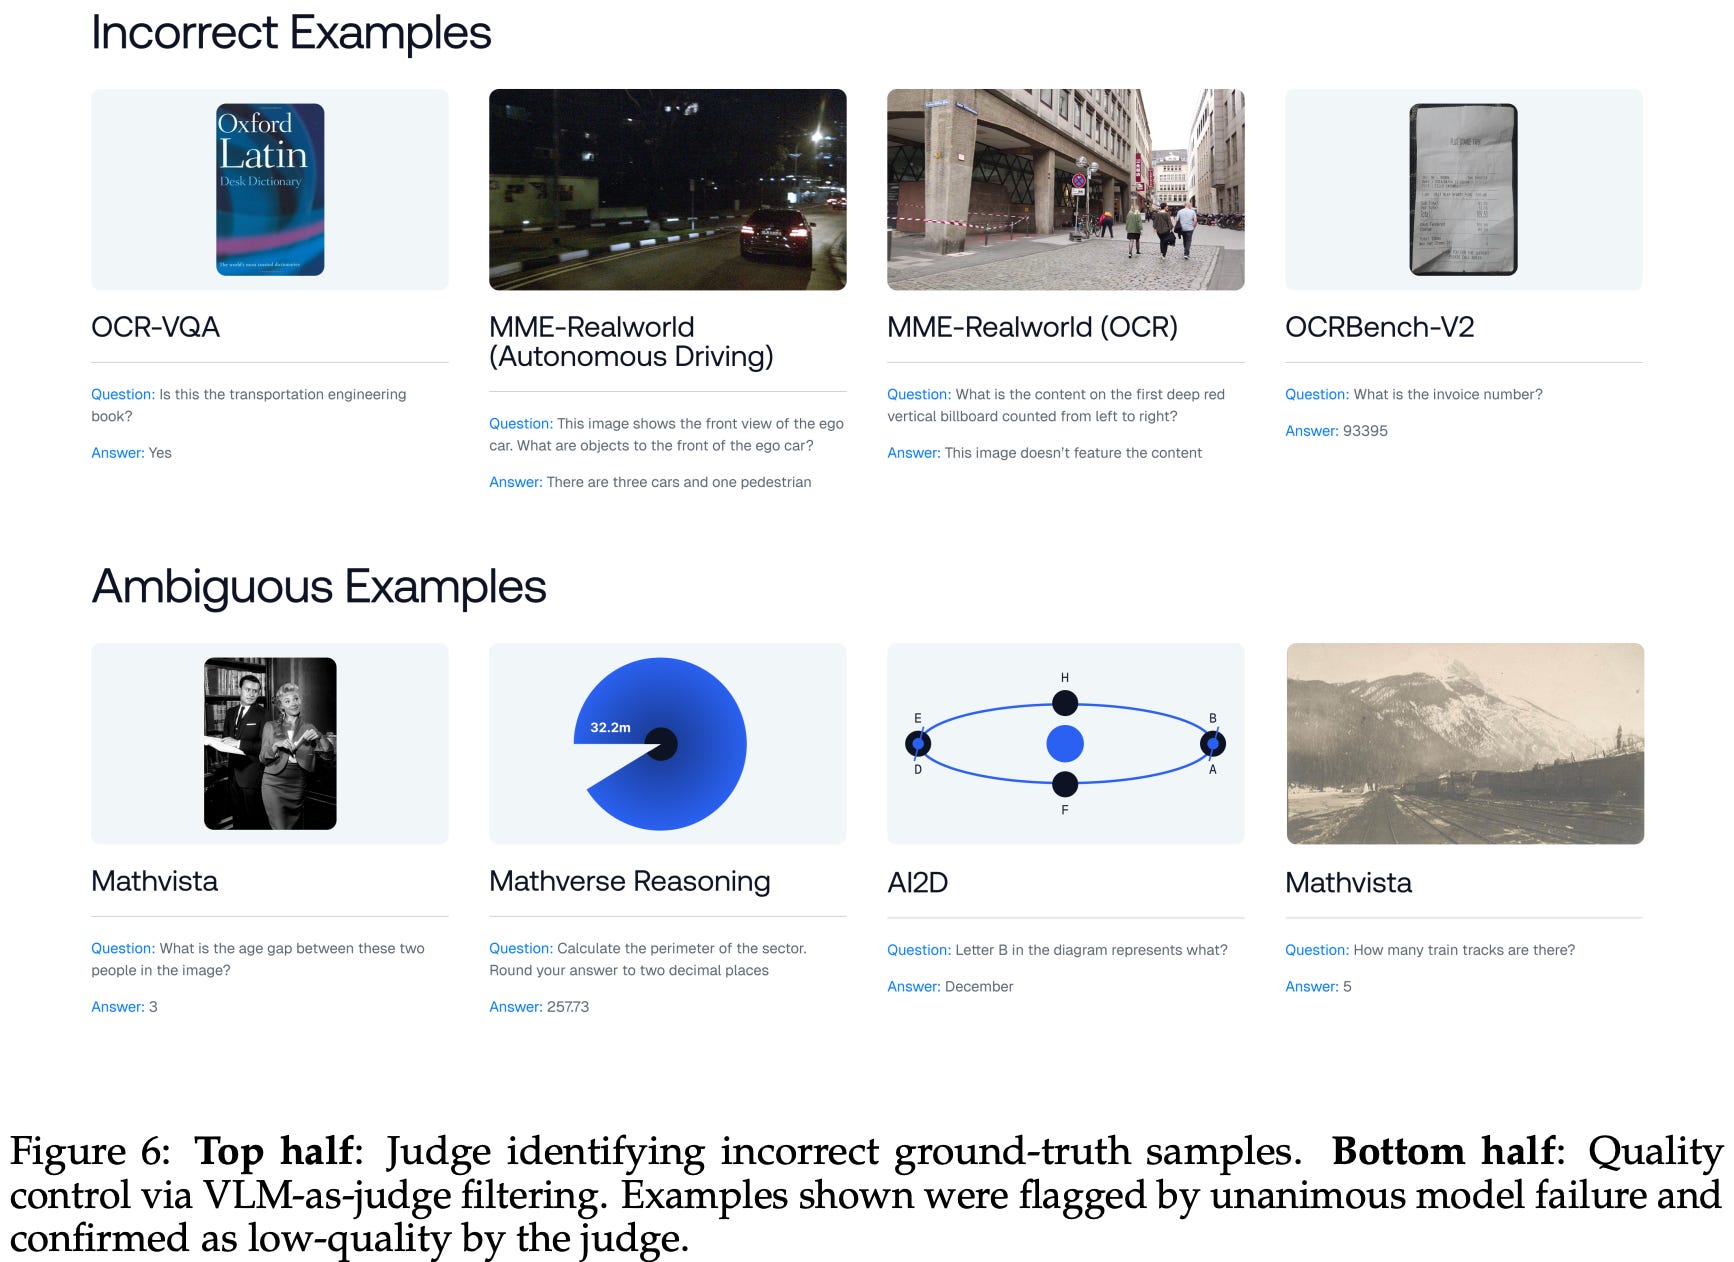
To differentiate between these cases, we perform a second stage of filtering based upon a frontier-level VLM judge. In this stage, every flagged example is passed through the judge to determine whether it is correct an unambiguous. Such an approach is reliant upon the asymmetry of verification (i.e., verifying a provided solution to a problem should be easier than generating a valid solution).
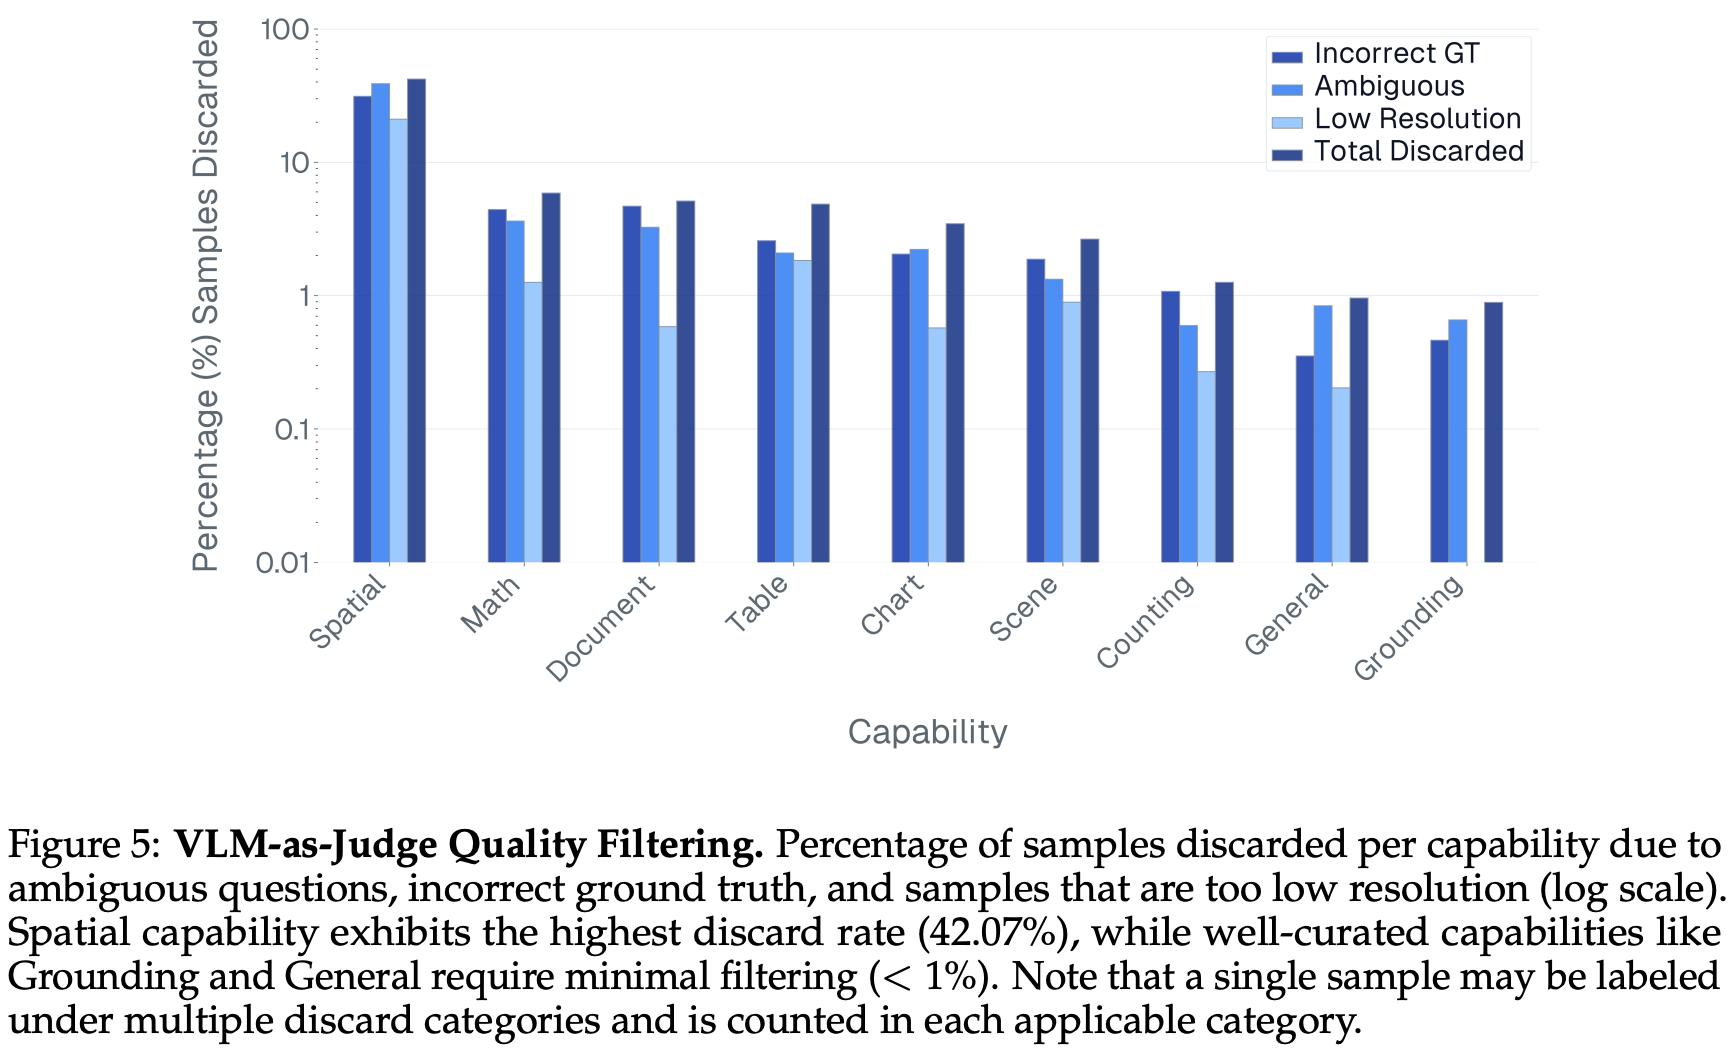
In an effort to prioritize quality over quantity, any data identified as ambiguous, incorrectly labeled, or unsolvable due to insufficient image resolution is removed. As shown above, this stringent filtering policy results in relatively high ratios of discarded data in certain domains. For example, over 42% of the spatial reasoning data is removed from DatBench due ambiguity or issues with data quality
Discriminative selection. Given increasing costs of evaluation, we would like to sample an evaluation subset to reduce costs without degrading discriminability—or the ability to identify differences in performance. One common approach is to sub-select evaluation samples while optimizing for rank correlation to find a smaller evaluation dataset that ranks models in the same way. However, this approach is prone to overfitting on a particular evaluation suite. An evaluation subset can preserve model rankings while still having noisy data that does not genuinely capture difference in model capabilities—we prioritize model rankings without deeply capturing the kind of data that is actually being selected.
“The core optimization problem is not merely to maintain ranking stability, but to maximize total discrimination. By ensuring every sampled example possesses high discriminative power, we can implicitly guarantee robust ranking while maximizing the information content per inference token.” - from [10]
Authors in [10] propose a solution to these problems that is based upon IRT. Directly applying IRT to VLM evaluation would work poorly, as we do not have enough data. Specifically, each data point would need to be evaluated with hundreds of different models in order to fit a stable IRT model. We do not have anywhere near this amount of data—only 27 models are used in [10] and getting access to hundreds of state-of-the-art VLMs would be very difficult (if not impossible).
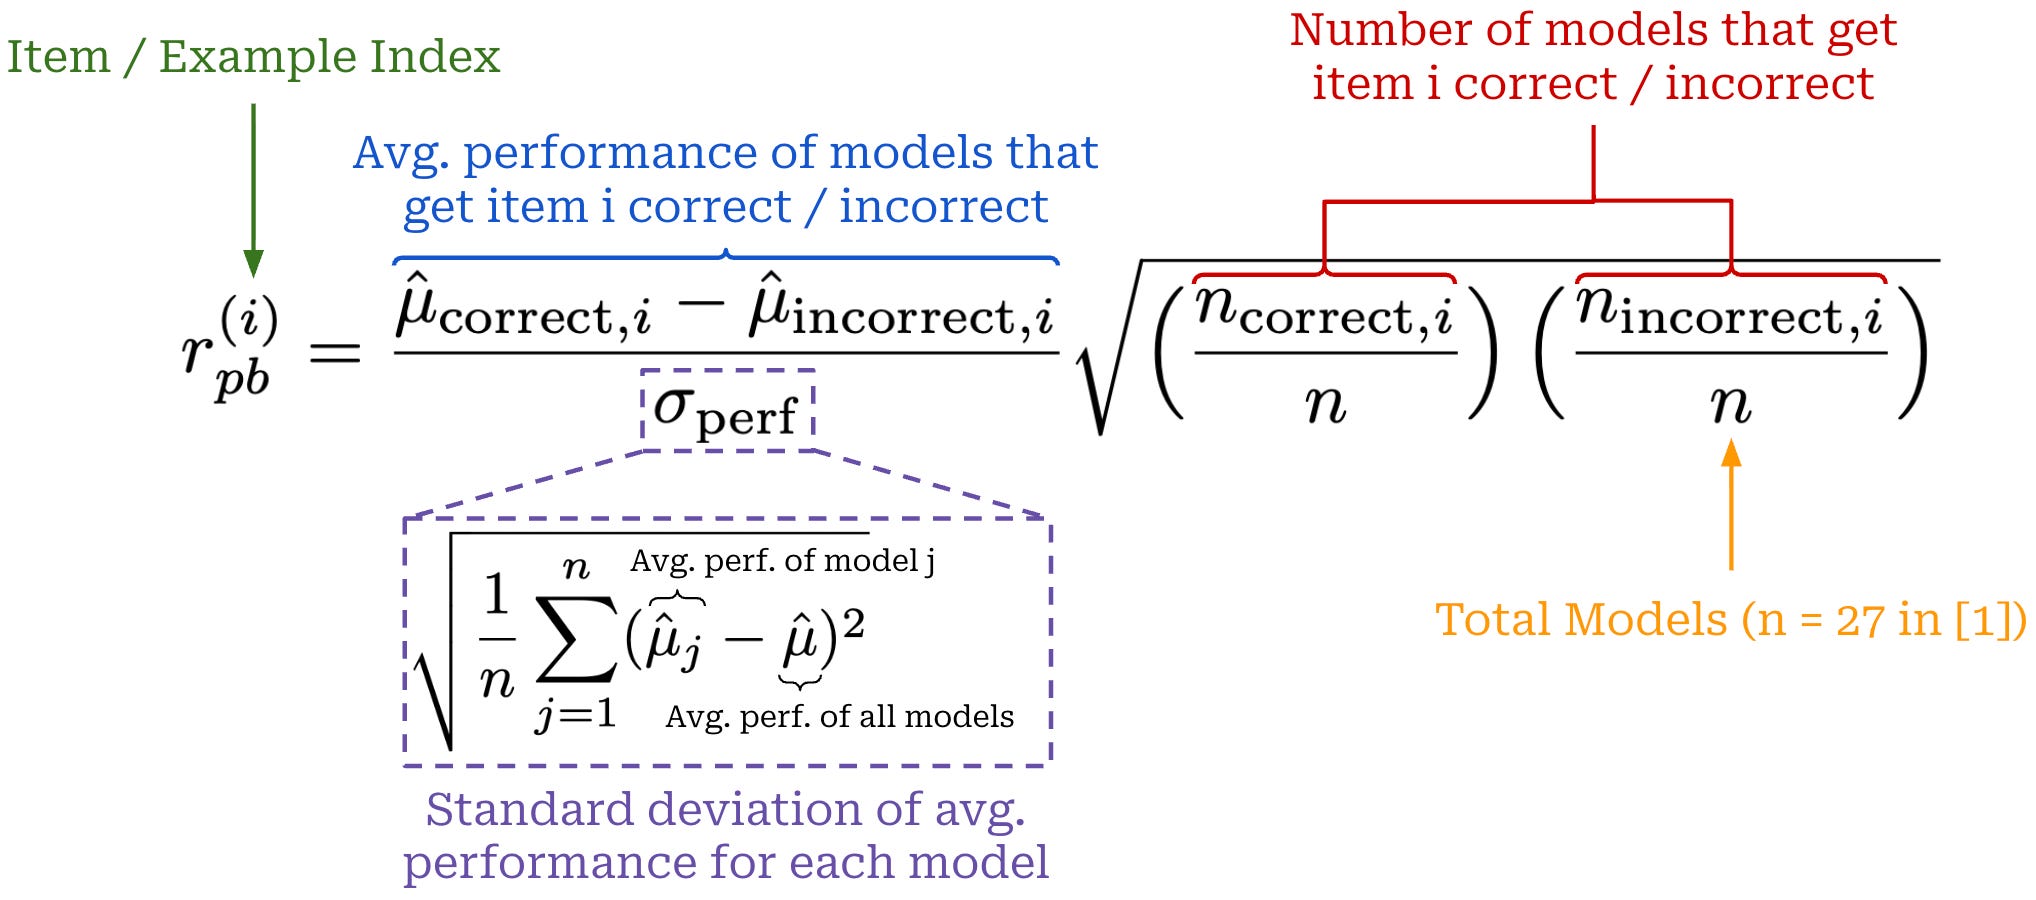
Instead of directly using IRT, data in [10] is selected based on information density, as captured by the point-biserial correlation (r_pb); see above. Computed per evaluation example, r_pb captures the relationship between scores on a single data point and global performance. As explained in [10]: “An item with high r_pb is one that strong models consistently answer correctly and weak models consistently miss; conversely, a low or negative r_pb indicates a noisy item.” The left term in the above equation captures the relative difference in global performance of models that get a given data point correct or incorrect, while the right term captures the ratio of models that get the data point correct or incorrect.
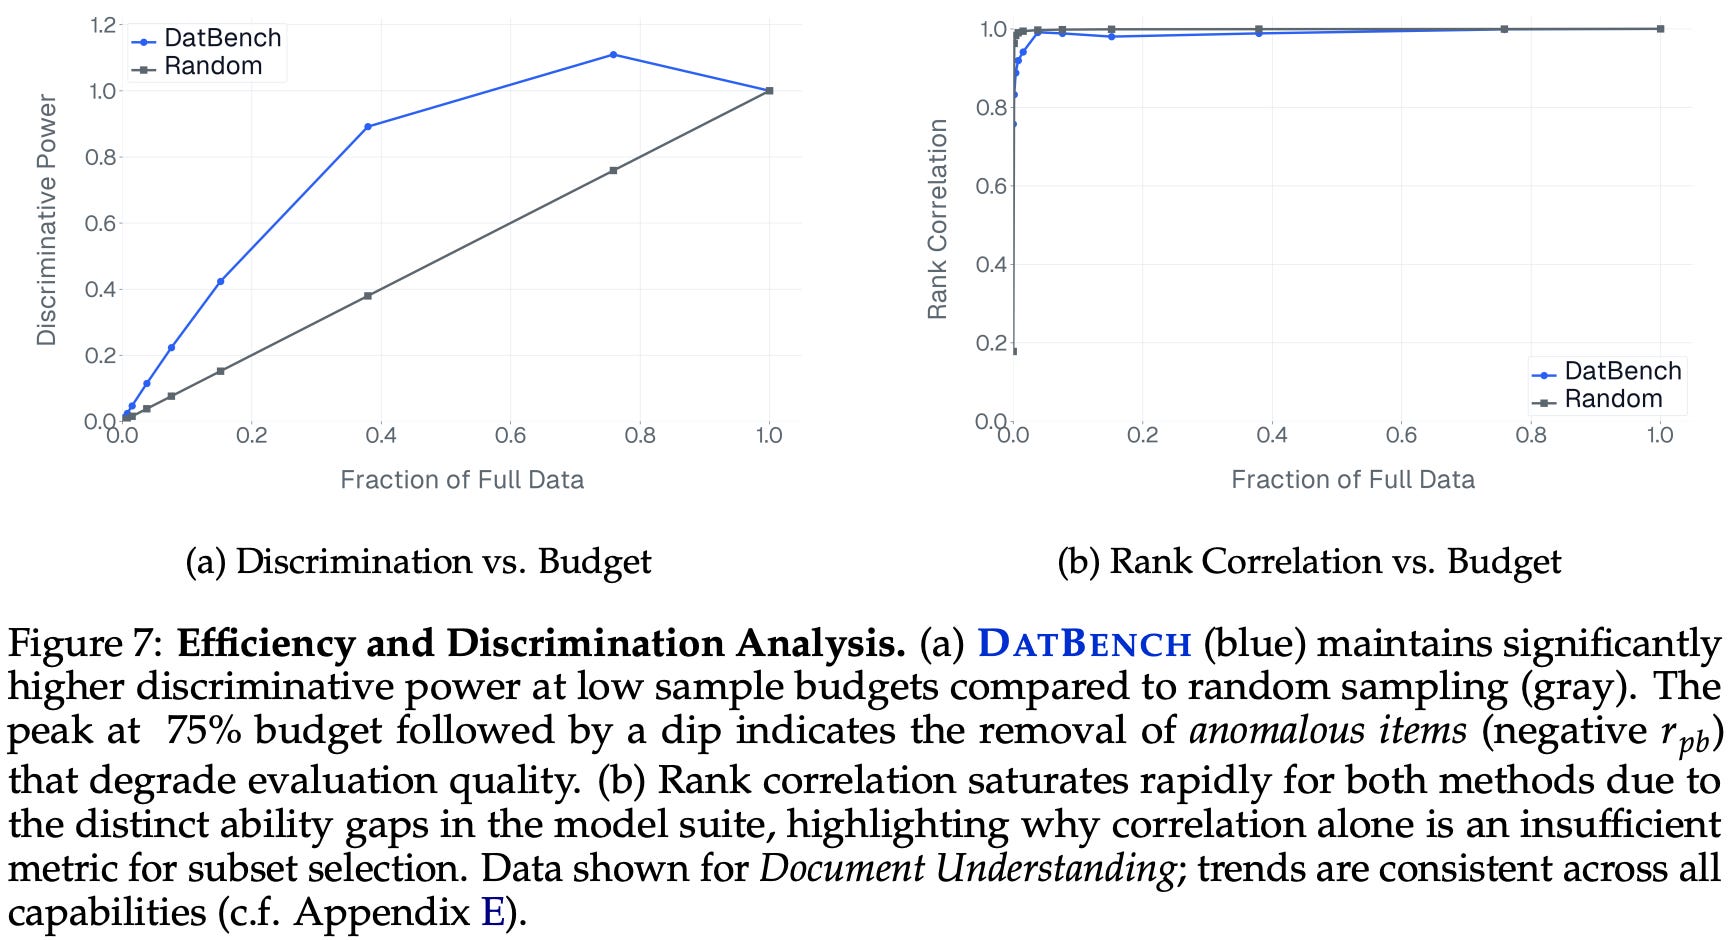
We select evaluation data in [10] by prioritizing examples with high r_pb per domain. To measure the total discriminative power of an evaluation subset, we can divide the total sum of selected r_pb score by the sum of r_pb scores across all data. As shown above, selecting data based upon r_pb allows us to preserve 90% of total discriminability with only 40% of the data, whereas rank correlation metrics saturate almost immediately. Interestingly, we also see that selecting all data is not optimal from the perspective of discriminative power. Noisy data (i.e., with low or negative r_pb) is left until the end of the selection process in [10].
The IRT-inspired approach is used to select 80% of evaluation data in [10], while the final 20% is manually reserved for frontier examples with low discriminative power. Namely, there exists a subset of evaluation data that has been validated by the LLM judge but is not answered correctly by any model. Any example in this subset will receive a low r_pb score because of the low ratio of correct model responses. However, such data captures legitimate frontier evaluation scenarios that should not be completely ignored within our evaluation dataset.
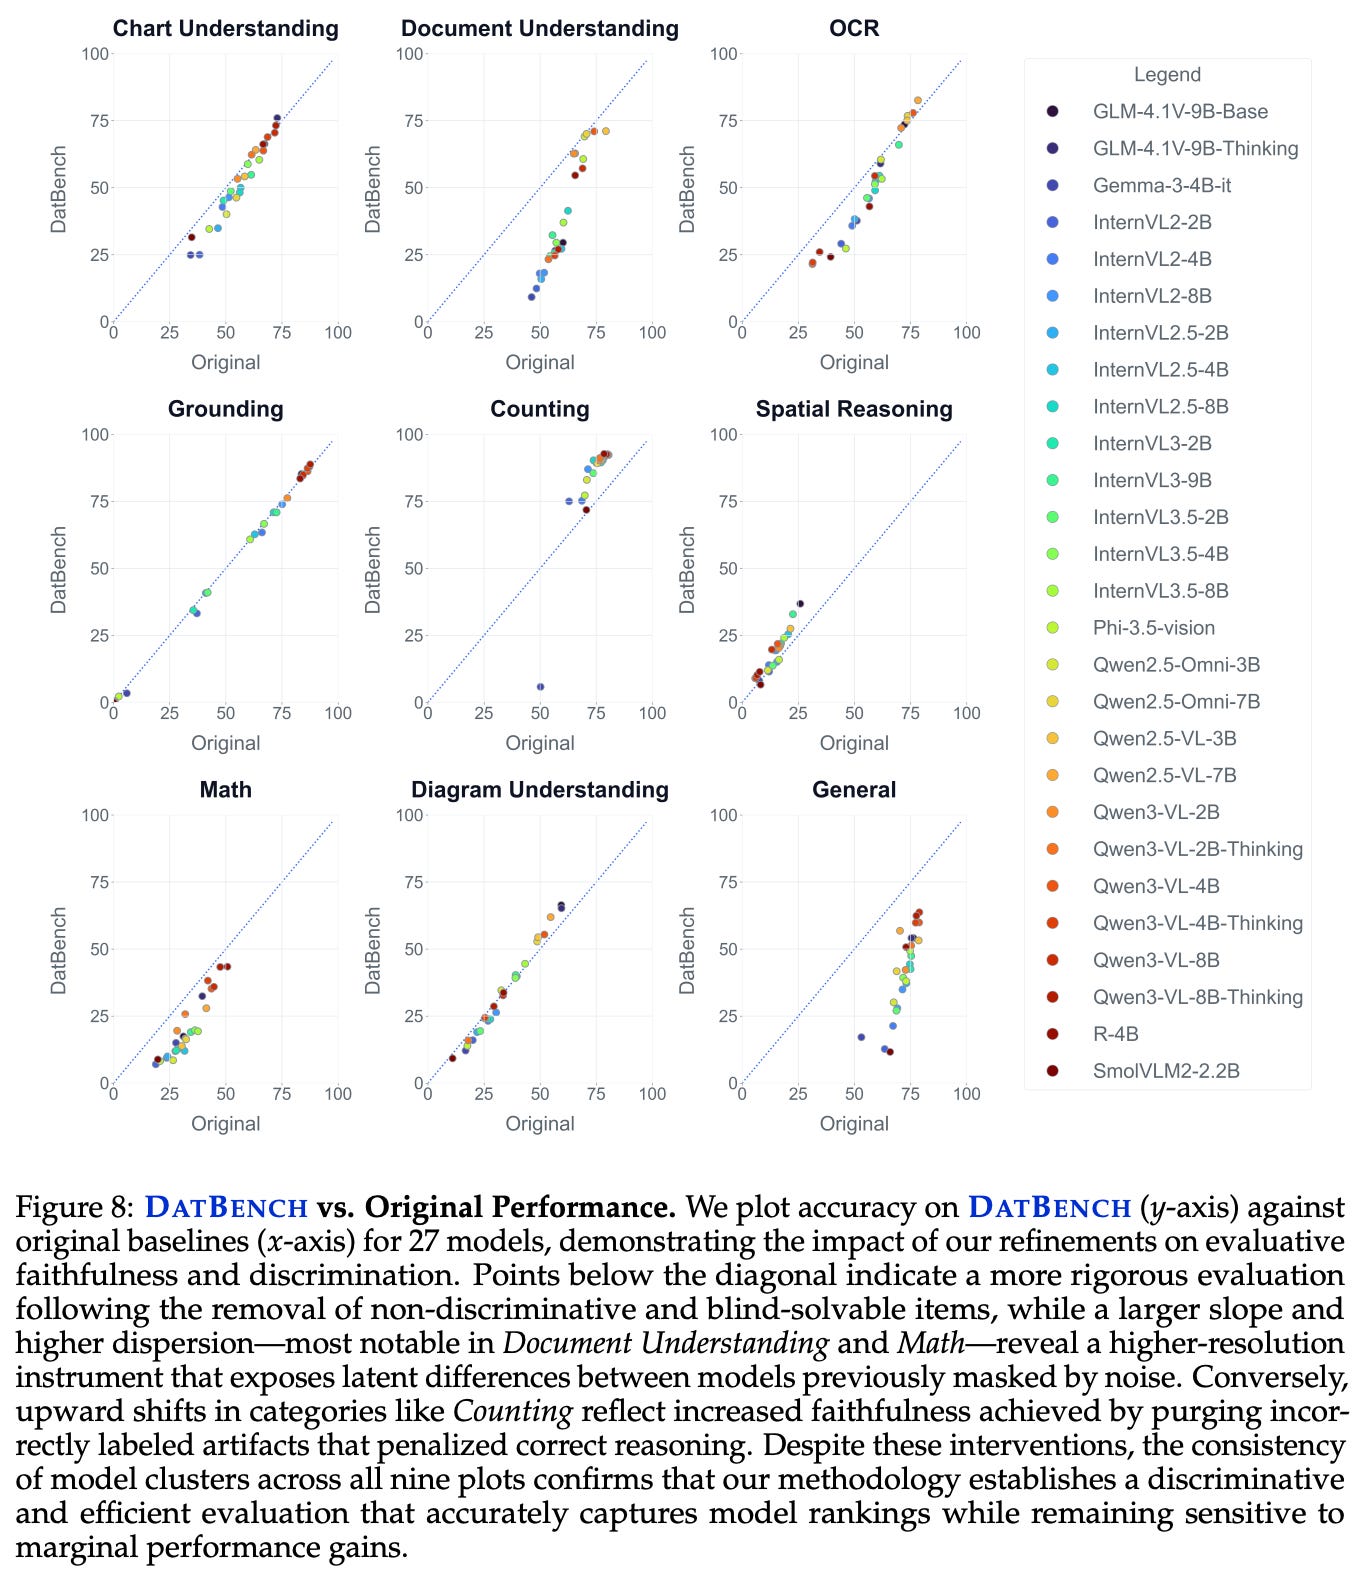
Key findings. Evaluation results on both DatBench and the original benchmarks are plotted above. Results on DatBench have a larger performance spread relative to those of the original benchmarks. For example, scores on general benchmarks range from 10-65% for DatBench versus 65-80% for original benchmarks, showing that DatBench mitigates benchmark saturation. In fact, just converting multiple choice questions to a generative format causes as much as a 35% performance drop. DatBench is found to yield a 13× speedup in the evaluation process while roughly matching the discriminative power of the original benchmarks.
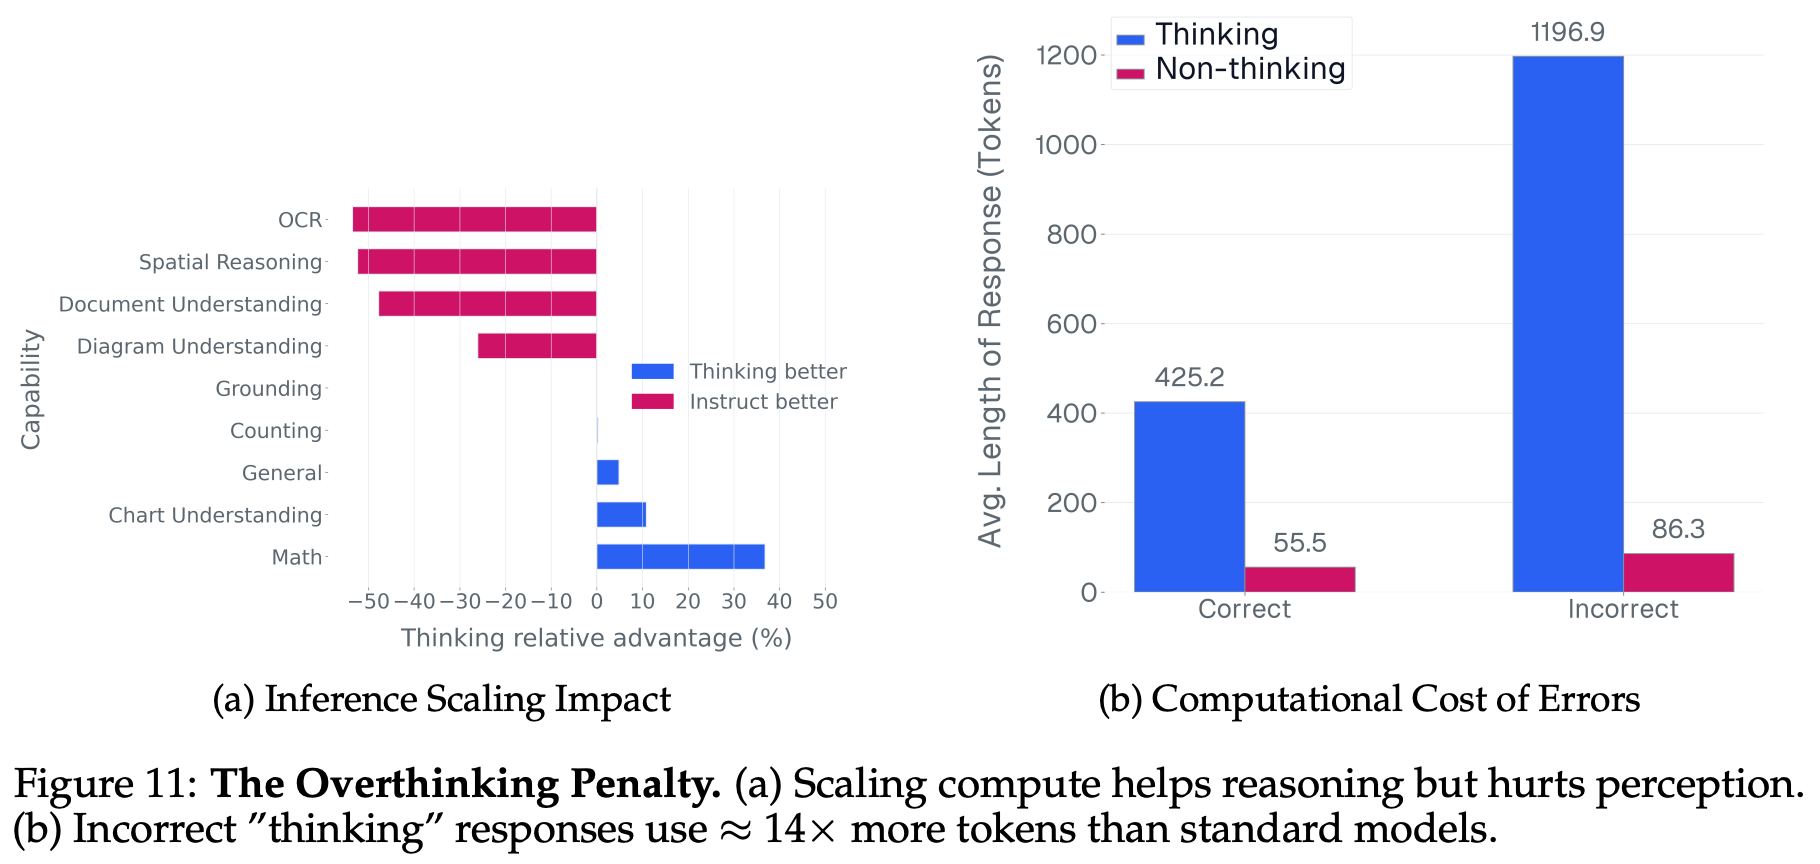
We can also repurpose the evaluation artifacts created by the DatBench pipeline to diagnose common failure modes of VLMs. Specifically, authors in [10] make the following observations:
A tradeoff between perception and reasoning exists in VLMs. Models that perform well on higher-level semantic processing tasks have degraded low-level perceptual fidelity. Finding a model that balances performance on both semantic and perceptual tasks is rare.
An “overthinking” problem exists within current VLMs, meaning that significantly fewer tokens are used when answering questions correctly versus incorrectly; see above. This problem is especially pronounced in reasoning models, where we see that an average length of a correct and incorrect response is 425.2 and 1,196.9 tokens, respectively.
The dependence of VLMs upon language priors, which can be measured via the performance difference between normal and blind evaluation, varies per capability; see below. For example, counting and grounding rely heavily upon vision information, but math and spatial reasoning are found to rely more upon language priors to guess a correct answer.
Although many VLM benchmarks are shown to be noisy and inflated in [10], we can learn a lot about current state-of-the-art by addressing these problems and selecting evaluation data that accurately captures model performance. Once we can identify shortcomings in performance (e.g., overthinking and perceptual gaps), improving model capabilities in these specific areas is much easier.
Keys to Creating a Useful Benchmark
We have studied a wide variety of LLM benchmarks and evaluation techniques in this overview. Given the many practical details peppered throughout the papers we have seen, we can gain a lot by considering the common concepts that continually arise across disparate benchmarks. By identifying these trends, we can (hopefully) identify key design principles for making a useful benchmark.
Domain Taxonomy. Most popular LLM benchmarks categorize their data into a fixed set of domains and sub-domains. By doing this, we make it easier to debug an LLM’s performance, as we can compute domain-level metrics within the benchmark. Additionally, organizing a benchmark into such a taxonomy naturally ensures that data is diverse and covers a decent breadth of topics. Leveraging a taxonomy can also make the evolution of a benchmark simpler over time by granularly measuring saturation at a domain level and enabling researchers to individually evolve each domain (e.g., as in BIG-Bench Extra Hard).
Human annotation. Despite the prevalence of synthetic data within LLM research, nearly all successful evaluation benchmarks rely on human experts to annotate data in some way. Some benchmarks begin with questions written by human experts (e.g., FrontierMath), while others leverage human opinions to measure question difficulty or accuracy (e.g., GPQA). Even when synthetic data is being used, human verification of data quality is usually helpful (e.g., IFEval and IFBench). In fact, review by human experts is even used in some cases to improve the quality of large-scale data obtained from noisy sources (e.g., crowdsourcing). Even today, manual inspection is one of the most effective tools for LLM evaluation.
Model-in-the-loop. Although humans play a massive role in the evaluation process, augmenting human efforts with an LLM can be beneficial. For example, LLMs are often used for difficulty filtering by simply identifying the questions that they get wrong. Additionally, trends in model performance allow us to fit IRT models and even identify less informative subsets of data (e.g., blind-answerable data in DatBench). Model-based approaches are helpful for identifying areas of a benchmark that may contain mistakes that can be routed to human review. We can also use LLMs to efficiently generate or reformat evaluation data that is later verified by a human annotator (e.g., MMLU-Pro adopts such a strategy).
Data quality. The best evaluation benchmarks tend to pull from high-quality data sources. For example, popular math benchmarks include questions that are taken directly from recognized math competitions, and reasoning benchmarks like BIG-Bench are sourced from vetted sources such as other proven datasets (as in BIG-Bench Extra Hard) or questions that have been extensively verified with human review (as in the original BIG-Bench). In fact, manually written questions from human experts are another commonly-used source of evaluation data, but we must implement measures to ensure data quality. The GPQA curation pipeline is a great example of an effective system for ensuring data quality and difficulty.
Realistic. Benchmarks are an imperfect proxy for measuring what we actually care about: the capabilities of an LLM. Depending on the questions that it tests, a benchmark may or may not accurately reflect the true performance of an LLM in the real world. Ideally, we want our benchmark to accurately capture an LLM’s true capabilities on a given task. To achieve this, we should make sure that evaluation data is as realistic as possible. One great example of how to achieve this goal is CursorBench, a coding benchmark that directly sources evaluation data from real coding agent sessions in Cursor and constantly releases new benchmark versions to better capture recent trends in agent usage.
Evolution. The capabilities of frontier-level LLMs are advancing rapidly, which can lead to benchmark saturation. In order to remain relevant, a good benchmark must evolve (and improve) over time. One of the best examples of this trend is BIG-Bench, which was already saturated less than a year after its initial release. Instead of simply allowing the benchmark to become irrelevant, improved versions were consistently released, such as BIG-Bench Hard and BIG-Bench Extra Hard. Many datasets can remain relevant and useful if we are willing to adjust the difficulty and scope of the benchmark as LLMs improve.
New to the newsletter?
Hi! I’m Cameron R. Wolfe, Deep Learning Ph.D. and Staff Research Scientist at Netflix. This is the Deep (Learning) Focus newsletter, where I help readers better understand important topics in AI research. The newsletter will always be free and open to read. If you like the newsletter, please subscribe, consider a paid subscription, share it, or follow me on X and LinkedIn!
Bibliography
[1] Hendrycks, Dan, et al. “Measuring massive multitask language understanding.” arXiv preprint arXiv:2009.03300 (2020).
[2] Wang, Yubo, et al. “Mmlu-pro: A more robust and challenging multi-task language understanding benchmark.” Advances in Neural Information Processing Systems 37 (2024): 95266-95290.
[3] Gema, Aryo Pradipta, et al. “Are we done with mmlu?.” Proceedings of the 2025 Conference of the Nations of the Americas Chapter of the Association for Computational Linguistics: Human Language Technologies (Volume 1: Long Papers). 2025.
[4] Rein, David, et al. “Gpqa: A graduate-level google-proof q&a benchmark.” First conference on language modeling. 2024.
[5] Srivastava, Aarohi, et al. “Beyond the imitation game: Quantifying and extrapolating the capabilities of language models.” Transactions on machine learning research (2023).
[6] Suzgun, Mirac, et al. “Challenging big-bench tasks and whether chain-of-thought can solve them.” Findings of the Association for Computational Linguistics: ACL 2023. 2023.
[7] Kazemi, Mehran, et al. “Big-bench extra hard.” Proceedings of the 63rd Annual Meeting of the Association for Computational Linguistics (Volume 1: Long Papers). 2025.
[8] Zhou, Jeffrey, et al. “Instruction-following evaluation for large language models.” arXiv preprint arXiv:2311.07911 (2023).
[9] Pyatkin, Valentina, et al. “Generalizing verifiable instruction following.” arXiv preprint arXiv:2507.02833 (2025).
[10] Joshi, Siddharth, et al. “DatBench: Discriminative, Faithful, and Efficient VLM Evaluations.” arXiv preprint arXiv:2601.02316 (2026).
[11] Polo, Felipe Maia, et al. “tinyBenchmarks: evaluating LLMs with fewer examples.” arXiv preprint arXiv:2402.14992 (2024).
[12] Hofmann, Valentin, et al. “Fluid language model benchmarking.” arXiv preprint arXiv:2509.11106 (2025).
[13] Dubois, Yann, et al. “Length-controlled alpacaeval: A simple way to debias automatic evaluators.” arXiv preprint arXiv:2404.04475 (2024).
[14] Vivek, Rajan, et al. “Anchor points: Benchmarking models with much fewer examples.” Proceedings of the 18th Conference of the European Chapter of the Association for Computational Linguistics (Volume 1: Long Papers). 2024.
[15] Xu, Cong, et al. “Data efficient evaluation of large language models and text-to-image models via adaptive sampling.” arXiv preprint arXiv:2406.15527 (2024).
[16] Perlitz, Yotam, et al. “Efficient benchmarking (of language models).” Proceedings of the 2024 Conference of the North American Chapter of the Association for Computational Linguistics: Human Language Technologies (Volume 1: Long Papers). 2024.
[17] Kipnis, Alex, et al. “metabench--A Sparse Benchmark of Reasoning and Knowledge in Large Language Models.” arXiv preprint arXiv:2407.12844 (2024).
See page 15 of the MMLU paper [1] for an itemized list of all 57 tasks.
See pages 5-6 of the GPQA paper [5] for a list of all sub-domains.
Here, we interpret the probability score assigned by the model to a certain multiple choice answer option as the model’s confidence in that option.
A full list of filtering criteria and associated rationales can be found in Appendix D on Page 48 of the BIG-Bench Hard paper.
The paper does not explicitly state how the base prompts are sourced. Authors just mention that they “generate a set of base prompts”.
The level of overfitting on IFEval might also be caused by the simple fact that this benchmark is constantly tested by model developers as new models are being created. Therefore, new models are naturally selected based on their performance on this benchmark (and other popular benchmarks).
An item that is more discriminative creates a separation between stronger and weaker models. This is an item that, if answered correctly, indicates that a model is capable.
Great breakdown of benchmark anatomy. One thing I've been thinking about a lot lately is how these evaluation principles translate (or don't) to agent-based systems. You mention explicitly scoping out agent and coding benchmarks, and I think that's where the biggest gap in evaluation methodology lives right now. Static benchmarks measure capability in isolation, but agent reliability in production depends on compositional correctness across multiple tool calls and reasoning steps. I've been exploring atomic claims as an evaluation primitive, decomposing model outputs into independently verifiable units, and finding that it surfaces failure modes that aggregate scoring completely misses. Would love to see a future piece extending this anatomy framework to agentic evaluation.